Let’s take a look at the banks’ results
In the midst of the Royal Commission into Misconduct in Financial Services, the major banks have released their latest half yearly results. The market headed into the reporting period with a high degree of apprehension given the public backlash emanating from the revelations coming from testimony at the Royal Commission to date.
In a number of articles over a long period of time, we have discussed our concerns about the outlook for revenue growth given the impact on loan book growth, that is likely to result from the turn in the long term structural decline in interest rates globally. Expected is a slowing of loan book growth, as volume growth is no longer boosted by the falling cost of debt, which has allowed households and businesses to sustain progressively higher levels of debt.
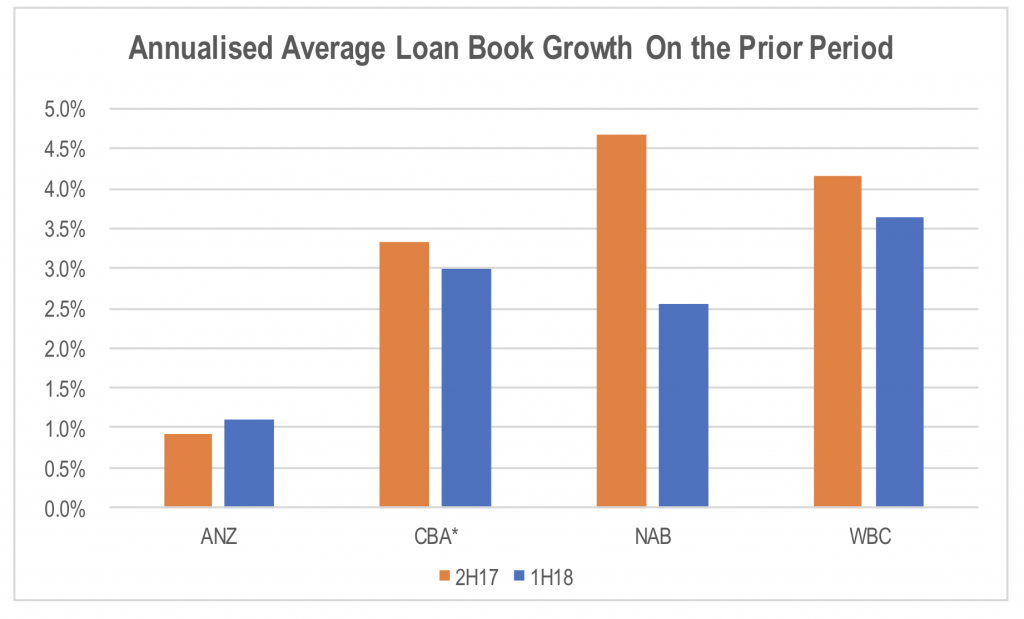
The first half results showed signs of this playing out, with loan book growth, based on the average balance for the period, continuing to slow on a sequential basis.
Source: Company Data *CBA data represents the 3 months to 31 March 2018
Slowing loan growth has been offset in recent periods by rising net interest margins, as a result of the repricing of interest only and investment property mortgage rates. In 1H18, the banks benefited from some easing in the level of competition for deposits.
However, over the last couple of months, the banks have been exposed to rising benchmark short term wholesale interest rates (BBSW and LIBOR) relative to official central bank rates. This is expected to see the funding costs of the banks shift from being supportive for net interest margins to now presenting a headwind.
Net interest margins were down for three of the four majors, with negative mix in mortgages (switching to lower rate principal and interest mortgages) and a full period impact of the bank levy offsetting any residual repricing benefit.
The other factor to take into account is the impact of trading and markets activity on the net interest margin. This is a very volatile part of the equation. For ANZ (ASX:ANZ) and National Australia Bank (ASX:NAB), a weaker trading performance relative to 2H17 reduced net interest margin (NIM) in 1H18, while for Westpac (ASX:WBC) it boosted NIM materially.
Given the volatility of this income, this is a low value driver of NIM and should be looked at in a historical context when projecting into forward periods due to the likelihood of mean reversion. This is particularly relevant for WBC’s result in which the Markets and Trading component of the NIM is well above historical levels and therefore should be treated with a degree of caution when forecasting from this base.
The chart below shows the annualised rate of growth in net interest revenue for the four major banks in 1H18 relative to 2H17. Growth, excluding the impact of trading, provides a better indication of the underlying sustainable rate of growth in the period as it strips out the volatile impact of trading activity on NIM.
Source: Company Data *CBA data represents the 3 months to 31 March 2018
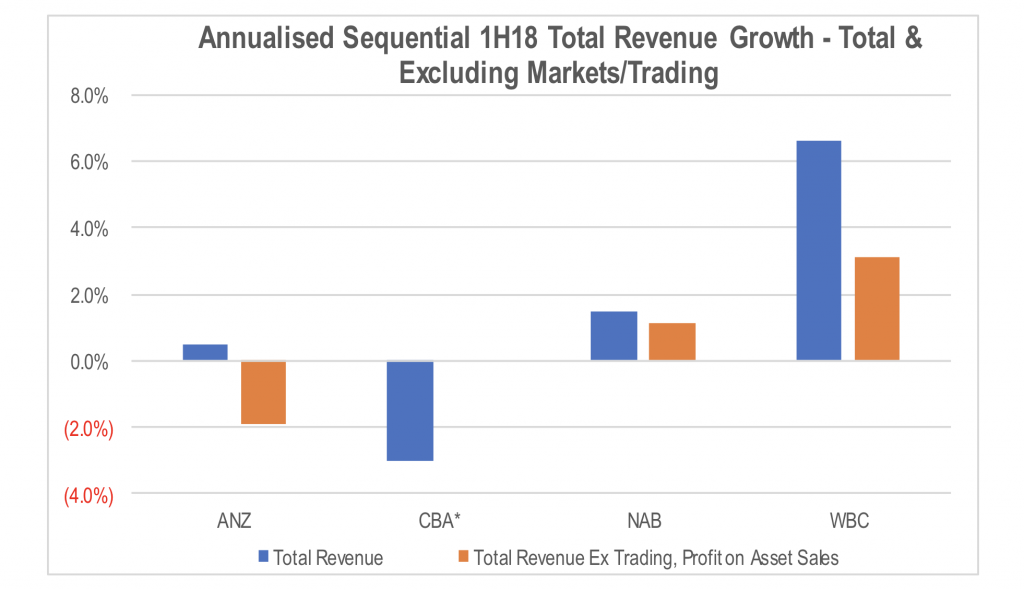
Non-interest income was similarly soft, particularly once trading revenues and one-off profits from the sale of investments and businesses are excluded. This resulted in total revenue growth in the low single digits. We note that the Commonwealth Bank of Australia (ASX:CBA) trading update provided limited detail on the underlying drivers.
However, according to CLSA Australia’s banks team, net interest revenue was negatively impacted by a restructuring charge on a hedge from a funding issue last year, as well as a reduction in trading revenue and a proportionally more significant impact from the increase in Bank Bill Swap Rate (BBSW) in March given CBA’s announcement was for three rather than six month earnings.
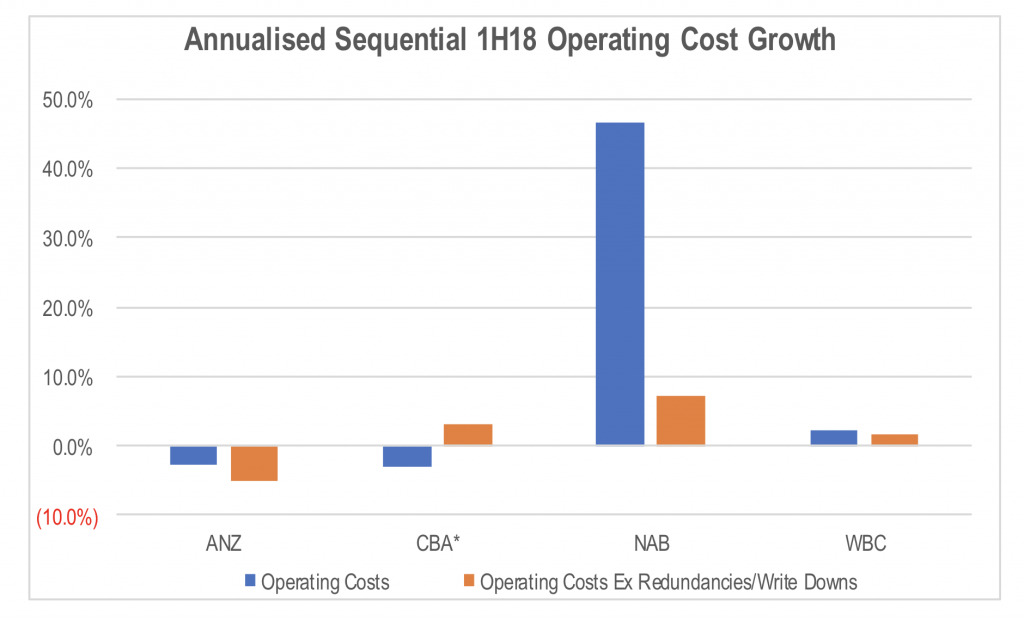
Operating cost growth was mixed with higher growth from NAB and CBA while ANZ continues to reduce its cost base. The Royal Commission resulted in elevated cost growth in the period, and this will continue into the rest of this calendar year and potentially beyond. Excluding this, revenue would have increased in the March quarter.
Source: Company Data *CBA data represents the 3 months to 31 March 2018
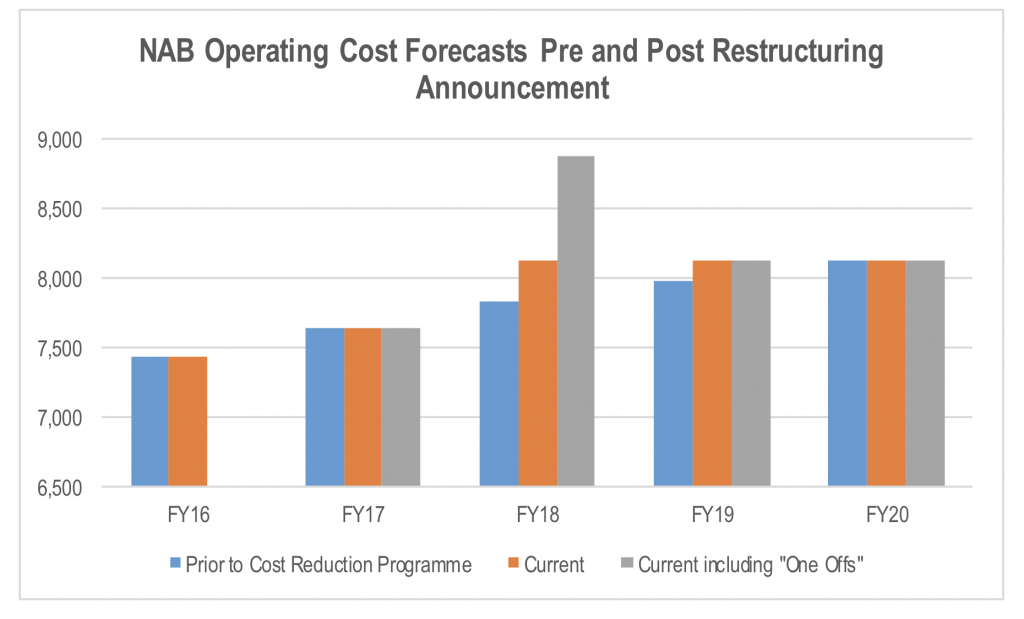
NAB’s increase excluding the upfront redundancies and write downs from its cost reduction strategy reflects an uplift in investment in the near term to assist the transformation of the business over the next few years. However, based on its guidance for flat operating costs between FY2018 and FY2020, aggregate costs over this three years period will be higher than average analysis forecasts prior to the announcement of the cost reduction programme in November last year.
Source: Company, UBS, JPM, CS, DB, CLSA, Citi
Slowing revenue growth is continuing to turn up the heat on management to reduce operating costs as an offset.
Provisions for bad debts were once again a positive for the net profit outcome.
Unlike in recent results, the main source of surprise came from lower new individual provisions rather than write backs of prior period charges. This is despite a continuation of the modest increases in mortgage arrears. Of most concern was CBA’s comment that “there has been an uptick in home loan arrears, influenced by a small number of customers experiencing difficulties with rising essential costs and limited income growth”. This could be the first signs of a squeeze on household budgets that has been a core part of the bear thesis for those warning about the outlook for the bank stocks.
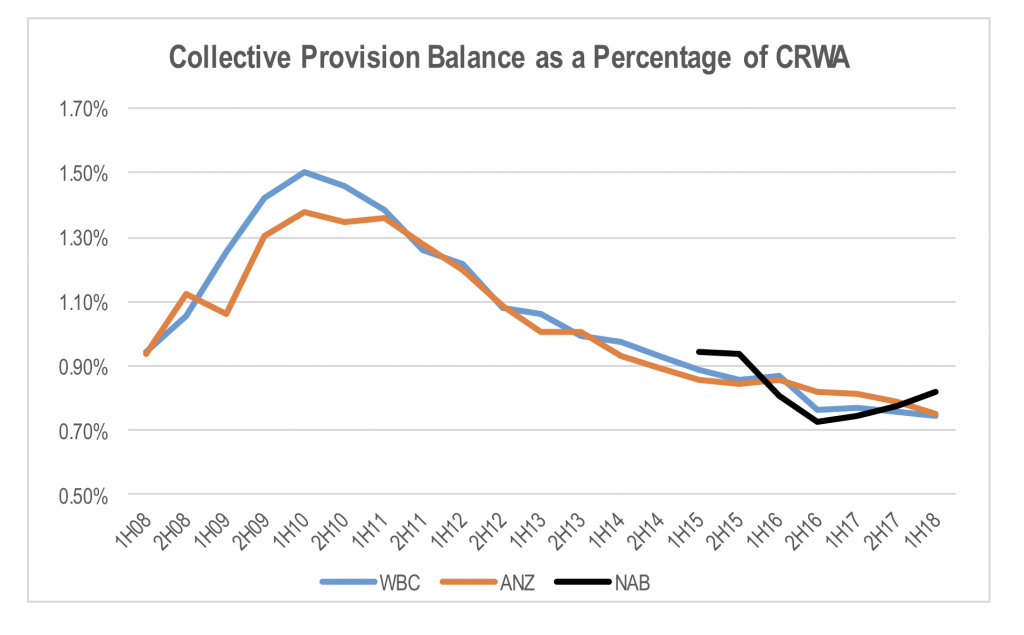
While ANZ and Westpac (ASX:WBC) continued to reduce their collective provision balance as a proportion of credit risk weighted assets (meaning these banks have less of a buffer against a downturn in credit quality), NAB actually increased its collective provision balance.
Source: Companies
Bank capital levels were generally in line with market expectations, with ANZ surprising to the upside. CBA highlighted the future impact of the Prudential Inquiry by APRA which will require it to increase its operational risk regulatory capital by A$1billion from 30 April 2018. The introduction of AASB 9 will also see CBA increase its collective provision balance by A$1.05 billion. These two issues will reduce CBA’s Common Equity Tier 1 *(CET1) ratio by 53 basis points. CBA expects a 70 basis point increase in its CET1 ratio from the sale of its Australasian life insurance operations in the next 8 months, but this will also reduce CBA’s sustainable earnings and capital generation in future periods.
The Montgomery Funds own shares in Westpac and Commonwealth Bank This article was prepared 15 May 2018 with the information we have today, and our view may change. It does not constitute formal advice or professional investment advice. If you wish to trade Westpac or Commonwealth Bank you should seek financial advice.
This post was contributed by a representative of Montgomery Investment Management Pty Limited (AFSL No. 354564). The principal purpose of this post is to provide factual information and not provide financial product advice. Additionally, the information provided is not intended to provide any recommendation or opinion about any financial product. Any commentary and statements of opinion however may contain general advice only that is prepared without taking into account your personal objectives, financial circumstances or needs. Because of this, before acting on any of the information provided, you should always consider its appropriateness in light of your personal objectives, financial circumstances and needs and should consider seeking independent advice from a financial advisor if necessary before making any decisions. This post specifically excludes personal advice.
INVEST WITH MONTGOMERY