Global investor positioning analysis: Insights, trends, and implications for investors
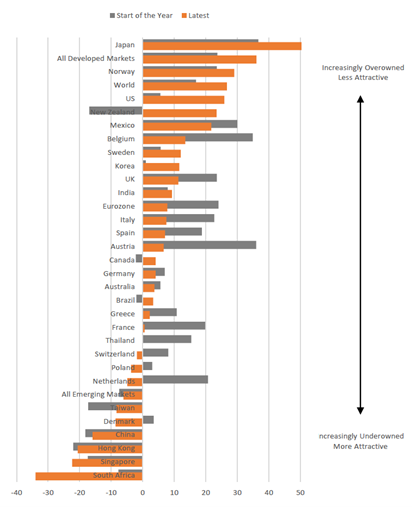
Crossborder Capital recently charted the dynamic shifts in global investor positioning. Measuring “Risk Exposure”, the analysis seeks to describe the extent to which investors have adopted risk, with the task being to identify which markets are ‘overbought’ or ‘oversold’.
The analysis becomes all the more poignant when considering the financial turbulence earlier this year – notably, the collapse of Silicon Valley Bank (SVB) and the takeover of Credit Suisse.
According to Crossborder Capital, “The data are based on investors’ holdings of equities and corporate debt (‘risk assets’) versus government bonds and cash (‘safe assets’).” Crossborder’s comprehensive study covers a broad spectrum of regions – from the World, U.S., China, Japan to the Eurozone, and the UK.
The UK based macroeconomics research house highlights a crucial observation about the indicator they employ: “It works well as a contrarian indicator, particularly at extreme readings. It highlights markets that are ‘under-owned’ with the potential to outperform, and others that are ‘over-owned’ with downside risks attached.”
While the major markets are at the forefront of this analysis, Crossborder Capital’s scope encompasses a more global perspective, including various emerging and frontier markets.
Figure 1. Crossborder Capital risk exposure / investor positioning
 Source: Crossborder Capital
Key insights drawn from Crossborder’s research include:
A shift in focus to developed markets: There is a noticeable pivot in investor sentiment towards developed markets (DM). Crossborder Capital points out, “Comparing current investor positioning with that at the start of the year shows that investors have tended to favour DM. Their exposure to emerging market risk assets has barely changed.”
Japanese and U.S. assets trending: Within developed markets, Crossborder Capital notes a particular preference for Japanese risk assets. Simultaneously, “there has been a notable increase in holdings of U.S. risk assets” since the start of the year.
Changing winds in the Eurozone: As for the Eurozone, risk assets seem to have steadied at “neutral” levels. A more granular look, as described by Crossborder Capital, reveals: “Year-to-date, investors are holding German risk assets in roughly the same proportion but have pared exposure to all other markets. Coming into 2023, Austria and Belgium were heavily ‘over-owned’: they have seen the biggest reduction.”
Figure 2. Austrian stock market index (Year to Date)

Interestingly, at the beginning of the year, when Crossborder Capital’s indicator suggested Austrian stocks were over-owned, the Austrian stock market was trading at about 3200 points. It continued to rally 12.6 per cent into early March. The market then fell 15 per cent and remains at about its market value at the beginning of the year.
Emerging market dynamics: When it comes to Asian risk assets, “[Emerging market] EM Asian risk assets remain ‘under-owned’.” The exception here is Korea. Interestingly, there seems to be a renewed interest in certain markets, with Crossborder Capital highlighting that “Investors are rebuilding exposure to Taiwan, China, and Hong Kong from a very low base,” while reducing their grip on Singapore and Thailand.
Contrarian opportunities: Taking a divergent perspective can often reveal hidden treasures. As per Crossborder Capital’s analysis, “South Africa, Singapore, Hong Kong, and China – all ‘under-owned’ – are the most attractive. Japan – heavily ‘over-owned’ – is the least attractive.”
In a world of rapidly changing economic landscapes, rarer, left-of-field insights from esteemed firms like Crossborder Capital can help investors gain an edge for navigating the complex world of investing, and ensure they remain a step ahead in their investment strategies.
Implications for Aussie investors
In recent weeks, our breakfast and lunch presentations to financial planners across Australia presented our arguments for Australian small caps being relatively good value, particularly compared to large-cap defensives, into which many investors have been herded amid fears of recession and inflation. Australian small caps also offer significantly better earnings growth prospects than large caps over the next three years.
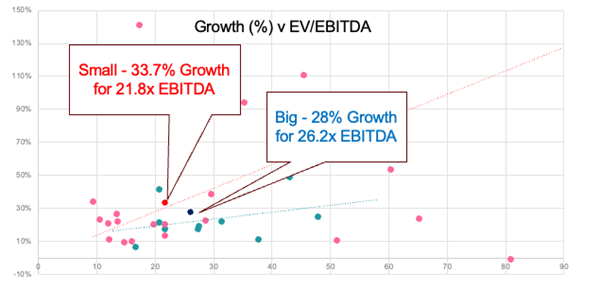
Figure 3. Australian small caps offer cheaper unit costs of growth

Source: Montgomery Investment Management, Factset, EV/EBITDA yr1, Growth = 2yr EBITDA CAGR, Top 10 big cap growth stocks, v 21 Small Cap Profitable Growth stocks, Data 7/9/23
Figure 3 reveals small caps are offering a higher rate of growth over the next two years than large caps while simultaneously trading at lower earnings before interest, tax, depreciation, and amortisation (EBITDA) multiple. This suggests small caps are seriously out of favour at present.
Indeed, we know that in terms of ‘factors’, simply being ‘small’ has been the single biggest cause of underperformance. It seems investors have traded growth prospects for the safety of liquidity offered by large caps.
Figure 4., reveals that following each of the last four major drawdowns in the small-cap index since the year 2000, small caps beat large caps over the subsequent 18 months, generating an averaging return of 46 per cent and the median active small-cap manager beat the small-cap index 100 per cent of the time, generating an average return of 58 per cent.
That’s encouraging because, between September 2021 and September 2022, the Australian Small Ordinaries index fell 27 per cent. Meanwhile, the index has only risen four per cent in the twelve months since that decline. If history repeats (which of course, it isn’t beholden to do) the median active small-cap manager could generate a return of between 17 and 81 per cent in the next six months. That’s obviously a very big call, and in my opinion, it’s unlikely to be fulfilled, but it does highlight the potential.
Figure 4. Small caps and active small cap managers recover best

Source: Montgomery Investment Management
And finally, it’s worth pointing out that Crossborder Capital’s analysis suggests the Australian market is neither over-owned, nor under-owned, suggesting there doesn’t appear to be a compelling level of risk adoption that would prevent the Australian market from rallying.