
Farewell Fiscal 2018, Hello Fiscal 2019
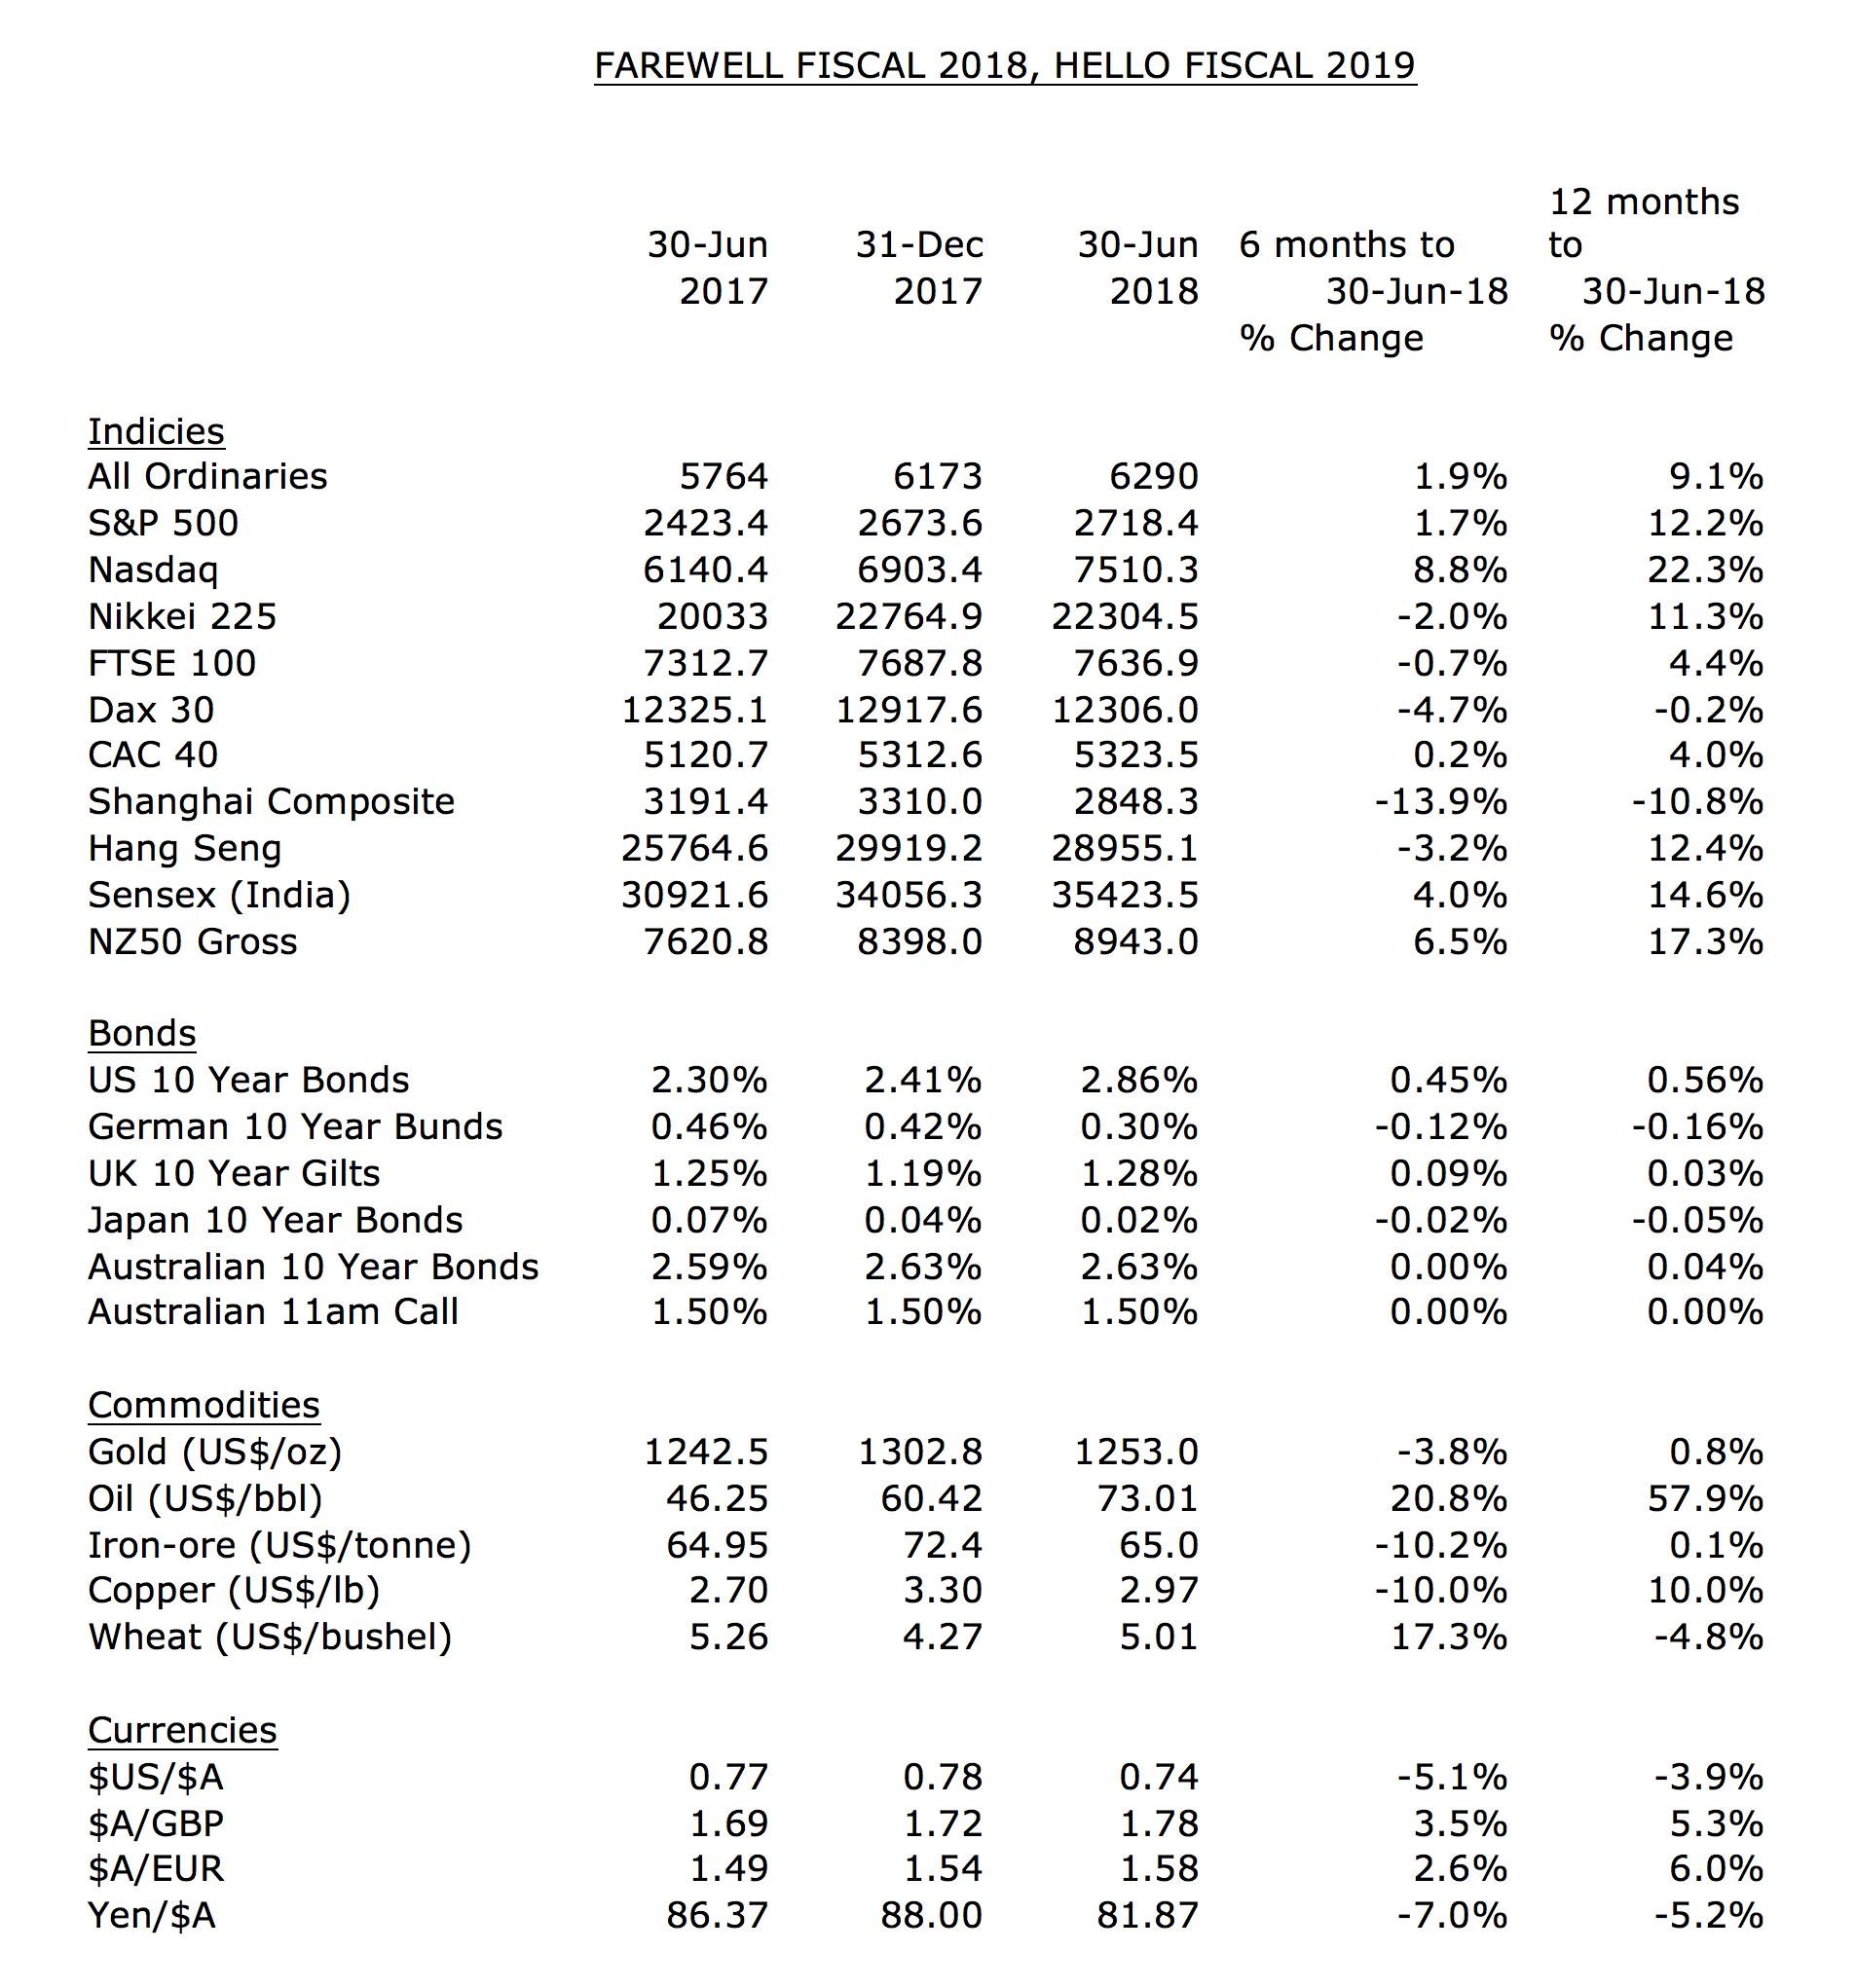
As Fiscal 2018 has drawn to a close, let’s take a closer look at the financial year that was. Excluding dividends, the Australian All Ordinaries Index was up 9.1 per cent to 6,290, and much of this gain took place in the December 2017 half-year.
The index is now 9 per cent from reaching the all-time high of 6,850 recorded in November 2007. Will it take another year for this 9 per cent to materialise? Those indices that did significantly better than Australia over the financial year included the US Nasdaq (+22.3 per cent), the NZ50 Gross (+17.3 per cent) and the Indian Sensex (+14.6 per cent).
With US ten year bonds briefly exceeding 3.0 per cent (and closing the financial year at 2.86 per cent) and the US/ China trade war heating up, many markets struggled during the June 2018 half-year.
Of note, was the Shanghai Composite Index, which declined 20 per cent from its late-January 2018 peak of 3,560 to close the financial year at 2,848. The technology heavy Nasdaq Index was an exception, up 8.8 per cent.
After boosting the US cash rate by 0.25 per cent in each of December 2016, March 2017, June 2017 and December 2017, the US Federal Reserve continued their tightening path. The US cash rate rose by 0.25 per cent in both March and June 2018, to finish the financial year in a range of 1.75 per cent to 2.0 per cent. With the Australian cash rate remaining steady at 1.5 per cent, as has been the case since August 2016, the Australian Dollar declined over the financial year by between 4 per cent and 6 per cent against the US$, the British Pound, the Euro and the Japanese Yen.
On the commodities front, Oil jumped by 58 per cent to US$73/ bbl. over the financial year. And this is despite Saudi Arabia recently producing at close to a record rate of 10.7 million barrels per day (mpd). Strong indications of synchronised world growth saw the Copper price rally from $2.00 to $3.30/ lb. over 2016 and 2017, however, in the past month it has declined 10 per cent to US$2.97/lb. on the back of the US/ China trade war threat. The iron-ore price hit a short-term peak of US$88/tonne in early-2017, and after averaging over US$71/tonne in 2017, it has come down in recent months, closing the financial year at US$65/tonne.
Chief Executive Officer of Montgomery Investment Management, David Buckland has over 40 years of industry experience.
David is a deeply knowledgeable and highly experienced financial services executive. Prior to joining Montgomery in 2012, David was CEO and Executive Director of Hunter Hall for 11 years, as well as a Director at JP Morgan in Sydney and London for eight years.
This post was contributed by a representative of Montgomery Investment Management Pty Limited (AFSL No. 354564). The principal purpose of this post is to provide factual information and not provide financial product advice. Additionally, the information provided is not intended to provide any recommendation or opinion about any financial product. Any commentary and statements of opinion however may contain general advice only that is prepared without taking into account your personal objectives, financial circumstances or needs. Because of this, before acting on any of the information provided, you should always consider its appropriateness in light of your personal objectives, financial circumstances and needs and should consider seeking independent advice from a financial advisor if necessary before making any decisions. This post specifically excludes personal advice.