
Don’t yield to income! Part II
Back in March with the help from the quant department in one of Australia’s leading investment banks, we prepared some data that allowed us to quantify the impact that lower interest rates have had on asset prices, in particular on the price of the S&P ASX 300 Index.
The S&P ASX 300 index measures the largest and most liquid 300 companies trading on the Australian stock exchange. So as a proxy for capital growth, this fits the bill perfectly.
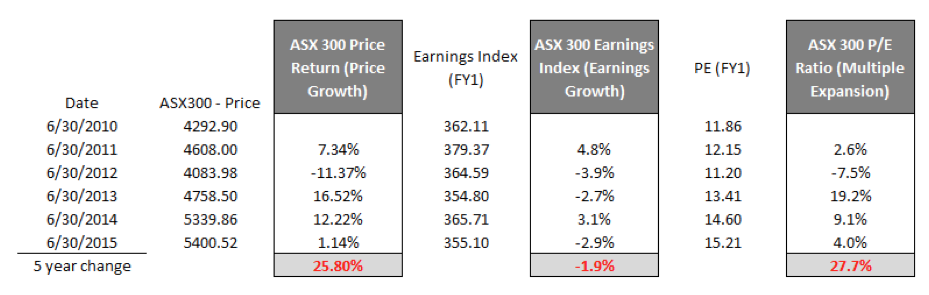
As a follow-up to that work, given the recent correction in the market, we again prepared a similar data-set. As you can see below, the market as measured by the S&P ASX 300 index, for the current financial year, has returned 25.8 per cent capital growth since June 30, 2010 – a five year period.
It was almost two years ago that we described a scenario in which investors would find rates on term deposits sufficiently unappealing that they would be forced out of cash and into other asset classes such as equities. Fast forward to today and we have witnessed that play out. Across the investment asset spectrum and across the world, the impact of central bank intervention has been felt.
Perhaps the table above goes some way to explaining the impact of low interest rates through investor migration. Interestingly, but not unexpected, is that during the five-year period under review the ASX300 Forward Earnings (FY1) index has declined by 1.9 per cent. That’s right, earnings have fallen, largely explained by resource and energy stocks, which was previously covered in another blog post. In other words, all of the gains in the broader market have been driven by what is known as multiple expansion (this is represented by the right hand side column of the table).
‘Multiple expansion’ is a euphemism for ‘people willing to pay more’. As a result it is worth noting Price/Earnings’s have expanded by nearly 28 per cent since June 30, 2010.
This draws one simple conclusion; our buoyant stock market is not justified by its earnings growth, and signs of bubble-like activity elsewhere suggest that underlying fundamentals (earnings/cash flow improvement) are not driving the market in aggregate, more central banks.
Of course, underneath the broad indexes lies a number of businesses that are compounding their earnings at well above market average rates. It’s these businesses we continue to look out for and buy for investors in our funds.
Russell Muldoon is the Portfolio Manager of The Montgomery [Private] Fund. To invest with Montgomery, find out more.
This post was contributed by a representative of Montgomery Investment Management Pty Limited (AFSL No. 354564). The principal purpose of this post is to provide factual information and not provide financial product advice. Additionally, the information provided is not intended to provide any recommendation or opinion about any financial product. Any commentary and statements of opinion however may contain general advice only that is prepared without taking into account your personal objectives, financial circumstances or needs. Because of this, before acting on any of the information provided, you should always consider its appropriateness in light of your personal objectives, financial circumstances and needs and should consider seeking independent advice from a financial advisor if necessary before making any decisions. This post specifically excludes personal advice.
INVEST WITH MONTGOMERY
Morning, Roger! It worked! Fantastic. Didn’t think to look at the basic data. But I should have known to do so, after all the times you’ve told us all to go back to the fundamentals behind the story/image. Lesson learnt!
Wam regards, Warren
Hi Russell,
Been trying to find a free source for the S&P ASX 300 Accumulation Index to use as a benchmark for my quarterly returns, but without any luck. Have found the basic ASX 300 on the S&P website. Can the Price and Earnings Indices be simply added together to compile a ‘close enough’ Accumulation Index? Or is there a free source available that the Mr Average can access?
Looks like its time Australian investors starting looking more to fundamentals than interest rates, Russell. Thanks for the interesting article.
Warren
G’day Warren, this should help (select 1 year on the chart and then click export – an excel/csv file of the last year’s accumulation index returns is delivered to your downloads folder): http://au.spindices.com/indices/equity/sp-asx-300