
Digging a little deeper into global liquidity
Liquidity is a concept critical to understanding investment markets.
Back in mid to late 2022, we wrote several posts on our blog and articles in The Australian, compelling investors to consider and pay attention to the very low price-to-earnings (P/E) ratios at which equities were trading.
In the case of U.S. small-cap companies, for example, P/E ratios were the lowest in 25 years, except during the global financial crisis (GFC).
At that time, we noted that if an investor purchased a stock on a P/E of, say, 12 times earnings and then sold the stock on the same P/E some years hence, the investor’s return would equal whatever the earnings growth rate was over the holding period.
That compels investors to identify companies that can grow their earnings at double-digit rates because even if the P/E ratio doesn’t go up, they will still make a double-digit annual return.
P/E ratios reflect the popularity of the stock market. When stocks are unpopular, P/E ratios are low, as they were toward the end of 2022. When the stock market becomes popular, P/E ratios for stocks rise. Even if the company’s earnings don’t grow, rising popularity means investors are willing to pay more for the same dollar of earnings.
One major driver of a change in stock market popularity is liquidity. If more money is ‘sloshing’ around worldwide, it will find its way into all sorts of assets, including financial markets, as people look to invest or bet on rising prices.
For this reason, understanding liquidity provides valuable insights into the direction of ‘popularity’ via P/E ratios and market prices.
Background
Global liquidity drives asset prices. When market pundits talk about ‘risk-on’ or ‘risk-off’ they are perhaps unwittingly talking about responses to changes in global liquidity.
In the early days – the 1980s – when international markets were opening up to each other – global liquidity helped explain trading volumes and prices for bonds and currencies.
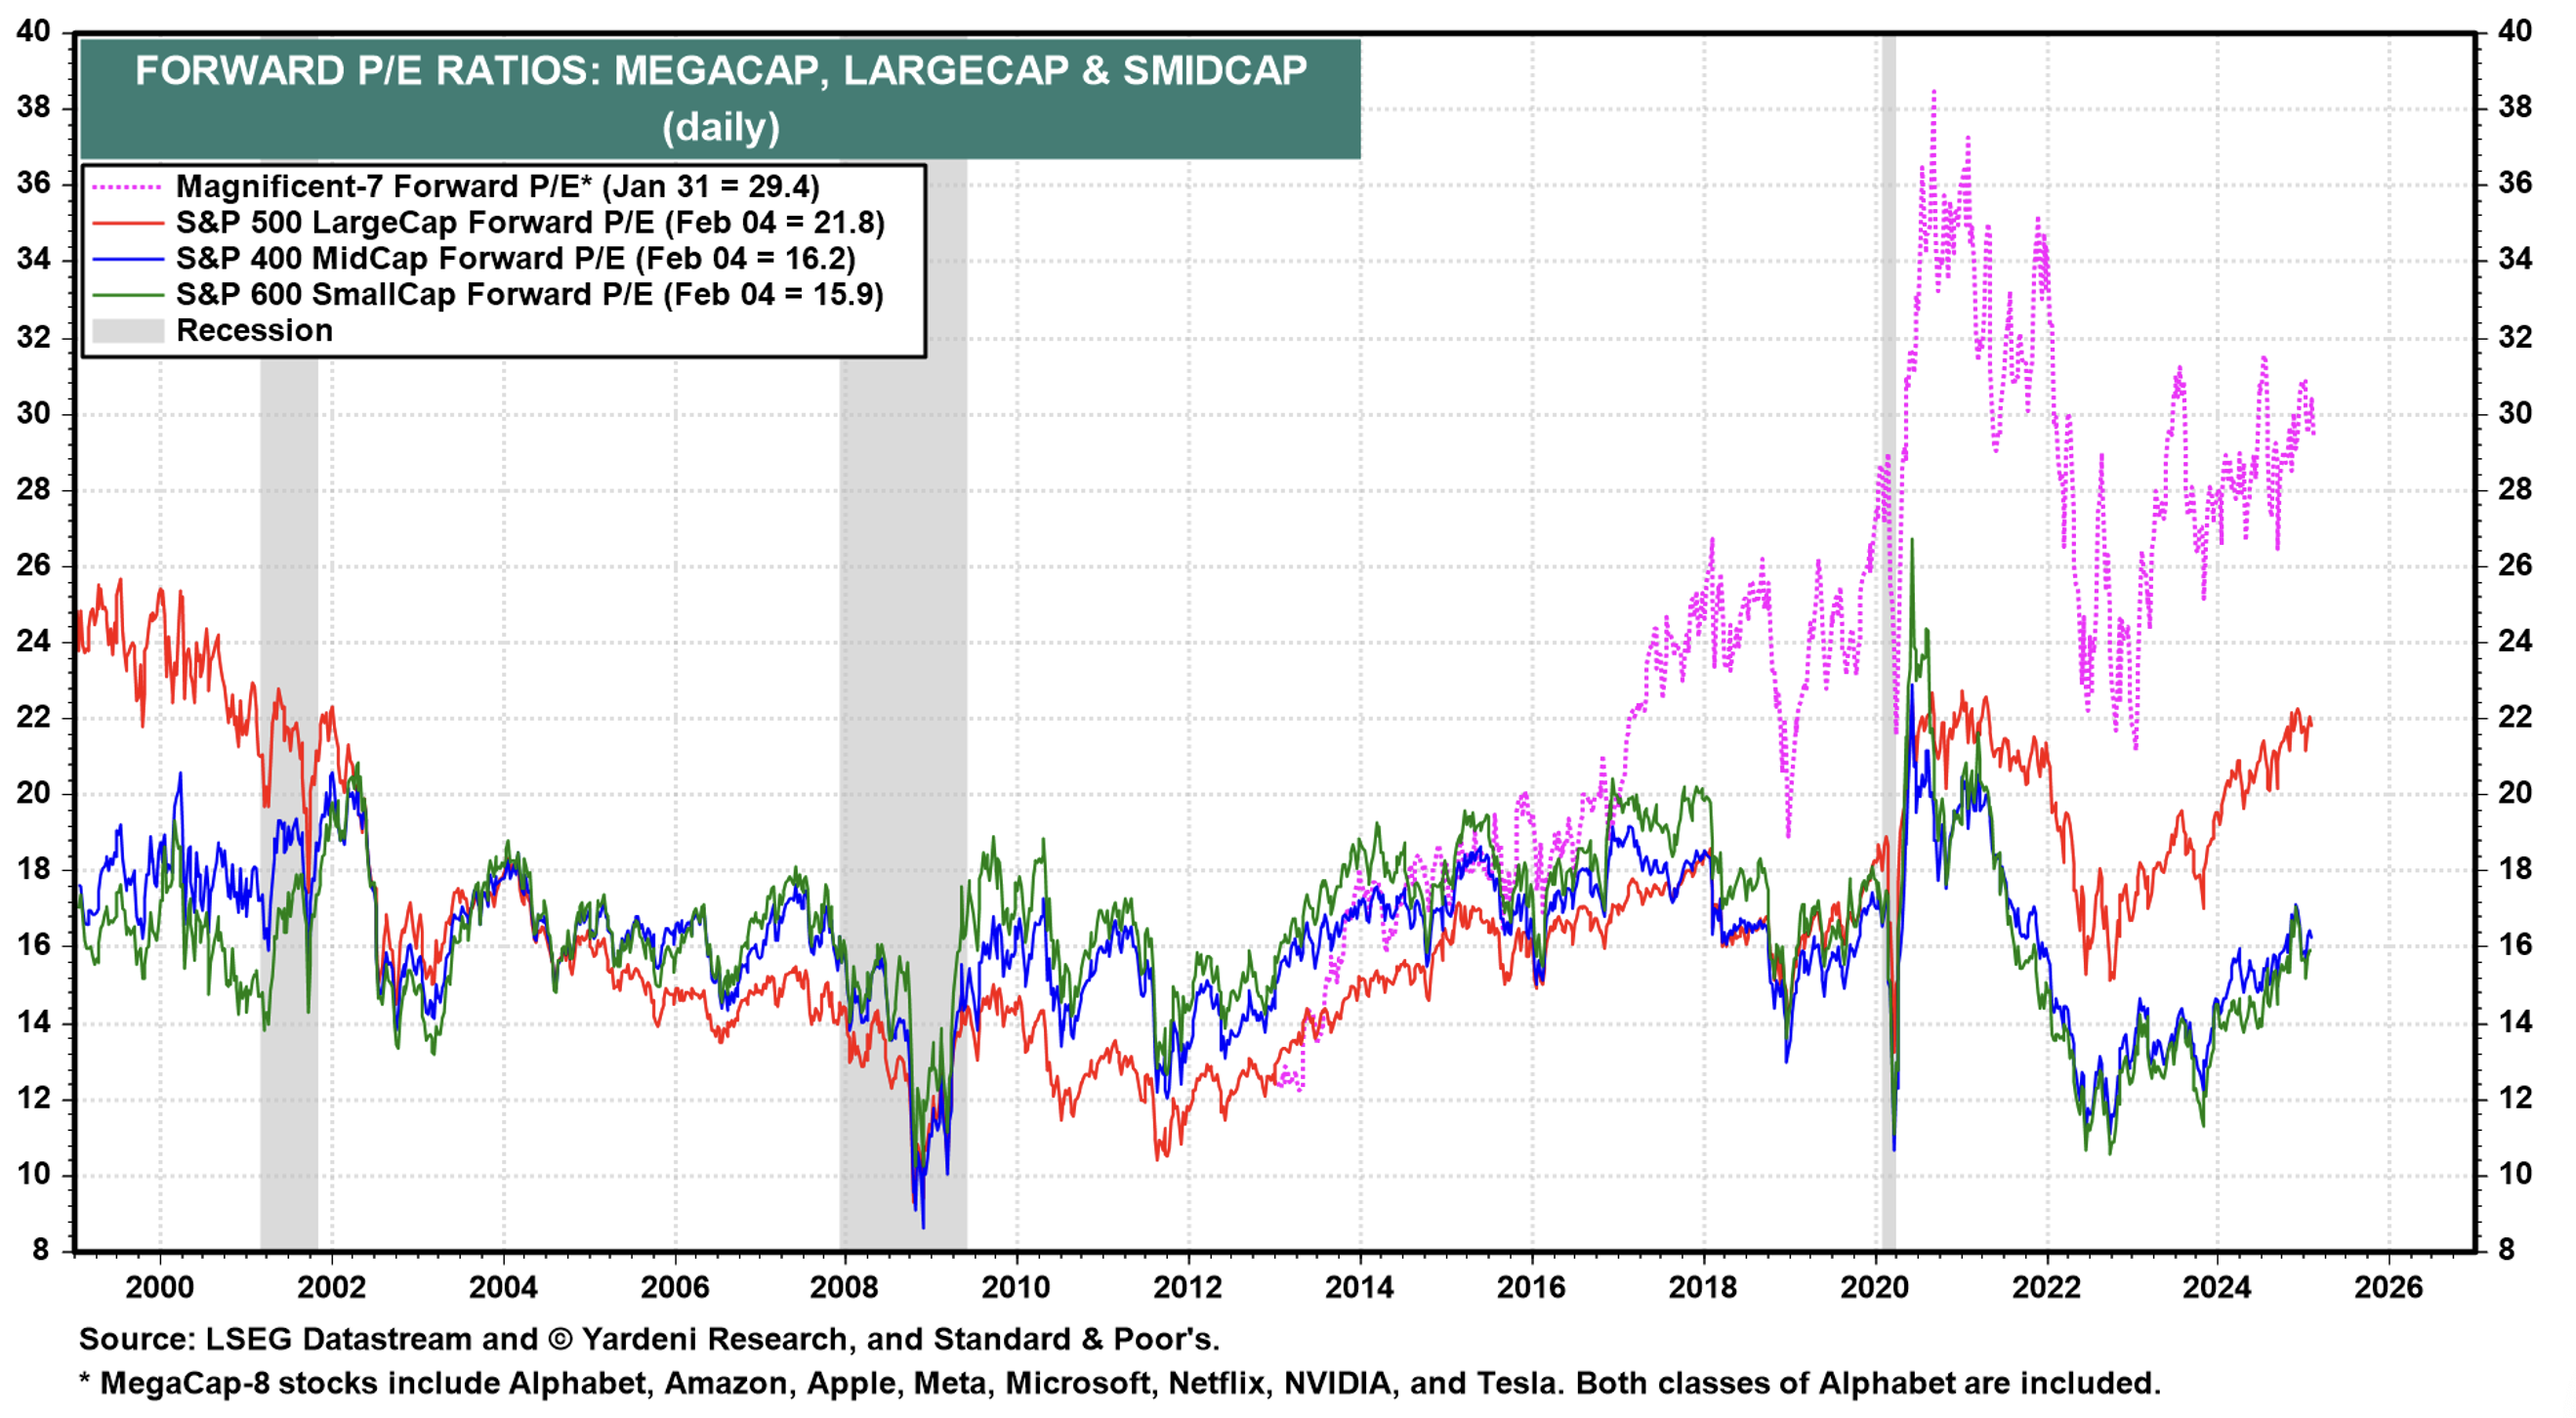
Global liquidity measures the flow of funds through financial markets and is the sum of all credit plus all cash savings. Most asset markets move in very close correlation with global liquidity. As Figure 1., reveals, the bounce in equity markets since 2022 is due primarily to rising P/E ratios – a willingness by investors to pay more than before for the same dollar of earnings. That move to higher in P/Es correlated with a bounce in global liquidity.
Figure 1. U.S. index P/E ratios, bounce since 2022
While equity markets reveal reliable correlations with global liquidity, movements in Bitcoin are perhaps the most highly correlated to global liquidity (typically reacting with a short lag).
Modern financial markets aren’t about raising new capital for capital expenditure (CapEx); instead, they are about debt refinancing, and a five-to-six-year cycle best describes the debt ‘refi’ cycle. Markets, particularly bond markets, arguably worry most about debt refinancing.
The most significant player in global liquidity is the U.S. Federal Reserve (Fed), alongside the U.S. Treasury. Their moves affect global financial markets. The next most important player in global liquidity is the People’s Bank of China (PBoC). When the PBoC moves, it affects the real global economy.
Many analysts, economists and commentators look at M2 money supply – a measure of the amount of money available in an economy – as a proxy for liquidity. But M2 only traces retail bank flows through the real economy. The financial system is much broader. The financial system includes the repurchase agreement (repo) markets, shadow banks and the enhanced measures used by central banks to influence liquidity.
Perhaps the most useful measures of global liquidity, such as the indices produced by research house CrossBorder Capital, also include some derivation of bond volatility as well. Why? Because most lending in financial markets is collateralised lending. In collateralised lending, the lender will impose a haircut on the collateral value. For example, if a borrower posts a U.S. Treasury bond as collateral, the lender will clip the bond value by a small percentage. The consequence of this is that the borrower will only be able to borrow, for example, 97 per cent of the value of the securities put up as collateral. The extent of the ‘haircut’ is determined by the level of bond market volatility. More volatility means more significant haircuts and, therefore, less liquidity being generated through collateralised lending.
Filling in the blanks; 2022 to 2024
During the COVID-19 pandemic, the Fed deployed its reverse repo account – which is a pool of money on the Fed’s balance sheet that doesn’t circulate in money markets – to soak up excess deposits in money market accounts that were generated by generous fiscal programs to support the economy by the government.
Separately, by reversing its previous quantitative easing (QE) program, the Fed sold bonds through quantitative tapering (QT) to take liquidity out of the market. Global liquidity was contracting and by September and October 2022, it bottomed out.
The stock market was, however, on its knees – remember the correlation between markets and liquidity? Necessarily, Jerome Powell, Chair of the Fed reportedly ran down its reverse repo account, reversing or unwinding the prior soaking-up of those money market deposits and putting liquidity back into markets. According to some, this, along with its Treasury General Account, is how the Fed has been injecting liquidity into markets since 2022, even as it engaged in QT.
Figure 2. Overnight Reverse Repurchase Agreements: Treasury Securities sold by the Fed in the Temporary Open Market Operations
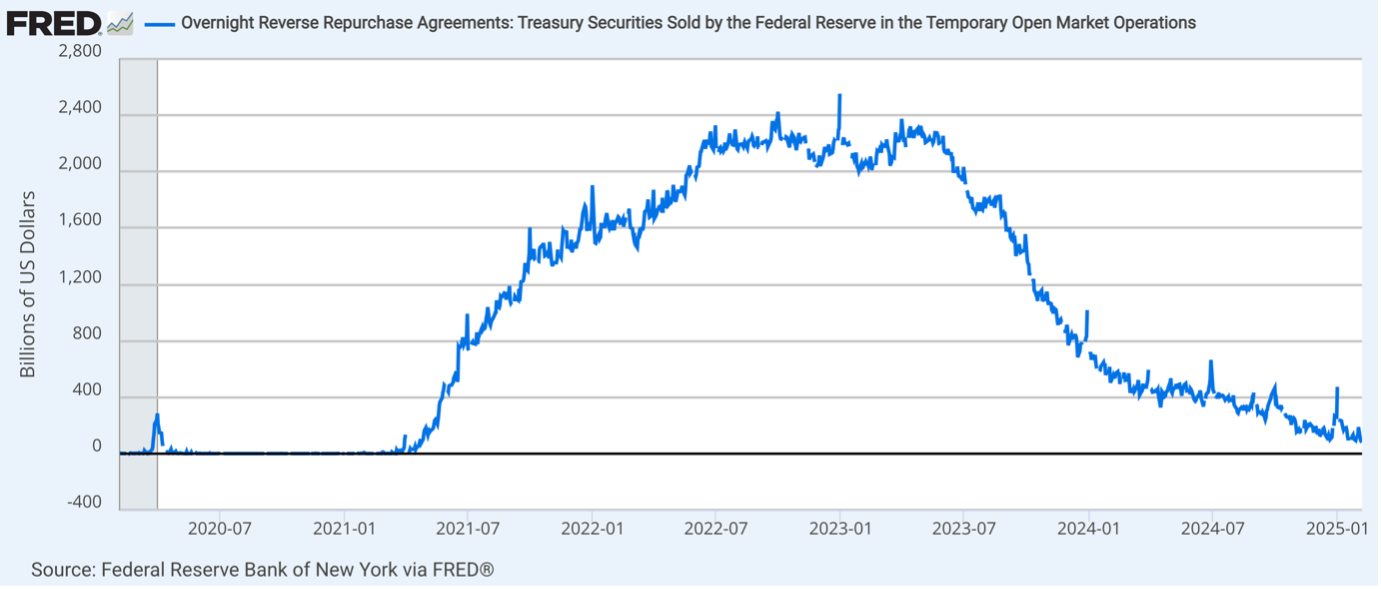 According to Figure 2., the reverse repo account has now been drawn down from circa US$2.6 trillion at its peak to just over US$120 billion.
The impact of this injection of liquidity was a peak of an additional 15 per cent of liquidity in the Spring of 2024. A total liquidity injection of US$6 trillion drove the S&P 500 up 25 per cent in 2024, gold up 25 per cent and Bitcoin up 140 per cent.
Today
The problem moving forward, as highlighted by Figure 2., is that these hidden stimuli are becoming exhausted.
Meanwhile, former hedge fund manager and now 79th Secretary of the Treasury, Scott Bessant said he will move away from Janet Yellen’s policy of frivolous short-term Treasury Bills (T-Bills) issuance. Instead, he will ‘term out’ debt and use coupons, meaning he will issue longer-duration bonds. This will have the effect of withdrawing further liquidity from the markets in the short term.
Treasury, however, desperately needs liquidity to finance the U.S. Government’s massive government debt. The bond market is working this out, which is why, when the Fed lowered interest rates, ten-year bond rates rose.
What next?
Capital markets have largely evolved from their original purpose of raising new capital for traditional industries to serving as sprawling platforms for refinancing debt. Consequently, the stability and momentum of financial and economic activity hinge on the availability of liquidity.
Moreover, the financial sector’s balance sheet capacity – referred to as liquidity – has become a far more significant driver of the economic cycle than interest rates. This has tethered the broader business cycle to the rhythm of the five-to-six-year debt-refinancing cycle.
The root cause of any financial crisis lies in liquidity shortfalls amid the inherent tendency of modern credit systems to accumulate debt. At their core, financial crises are fundamentally debt-refinancing failures – reflections of a systemic inability to roll over massive obligations.
To avoid a debt refinancing-related panic, the Fed will have to engage in QE again or find other ways to inject liquidity. Without liquidity support, markets in late 2025 or through 2026 could see rising volatility as the debt borrowed at ultra-low rates five years ago comes up for refinancing.
If significant liquidity support doesn’t occur, expect volatility in equities. And if support does occur many investors believe hard assets and U.S. dollar alternatives like gold will outperform.
Roger Montgomery is the Founder and Chairman of Montgomery Investment Management. Roger has over three decades of experience in funds management and related activities, including equities analysis, equity and derivatives strategy, trading and stockbroking. Prior to establishing Montgomery, Roger held positions at Ord Minnett Jardine Fleming, BT (Australia) Limited and Merrill Lynch.
He is also author of best-selling investment guide-book for the stock market, Value.able – how to value the best stocks and buy them for less than they are worth.
Roger appears regularly on television and radio, and in the press, including ABC radio and TV, The Australian and Ausbiz. View upcoming media appearances.
This post was contributed by a representative of Montgomery Investment Management Pty Limited (AFSL No. 354564). The principal purpose of this post is to provide factual information and not provide financial product advice. Additionally, the information provided is not intended to provide any recommendation or opinion about any financial product. Any commentary and statements of opinion however may contain general advice only that is prepared without taking into account your personal objectives, financial circumstances or needs. Because of this, before acting on any of the information provided, you should always consider its appropriateness in light of your personal objectives, financial circumstances and needs and should consider seeking independent advice from a financial advisor if necessary before making any decisions. This post specifically excludes personal advice.