Compare the pair: is it that simple?
The peak of the Royal Commission seems to have coincided with the peak in advertising air time for the industry super funds. I am not sure of the experience of the readership here on the blog, but it appears to me that the industry funds have really stepped up their campaigns over the last 12 months.
Recently on a visit to Port Macquarie and Coffs Harbour on the Mid North Coast of New South Wales, it was noted several times by Financial Planners that they were being asked to compare the returns of their investment portfolios to that of an industry super fund more frequently. But is it as simple as comparing the pair? As much as I like the meerkat ads at present, I think it can be dangerous to compare the returns of the industry super funds without understanding both the asset split and underlying assets that they hold. As such, I have put together a few points which I think need to be considered when making a comparison of an industry fund to that of another.
Basics of an Industry Super Fund
The first thing to note is that an industry fund is both a fund of funds and a multi-asset strategy. Moreover, the industry fund would appoint an investment manager who would then be responsible for sourcing investment mandates for the fund across a number of asset classes which can be passive and/or active, including (and not restricted to) growth assets such as local and international shares, private equity, alternatives, property and infrastructure, and defensive assets such as fixed interest, corporate and government bonds and cash (or cash derivatives). The industry fund would generally use their scale (or dollars under management) to negotiate lower management fees for the respective managers they choose. Their dollars under management can also be a double edged sword in the sense that they often have to choose several managers within an asset class due to capacity constraints of the managers based on the parcels that industry fund would like to invest.
Be mindful of Asset Allocation
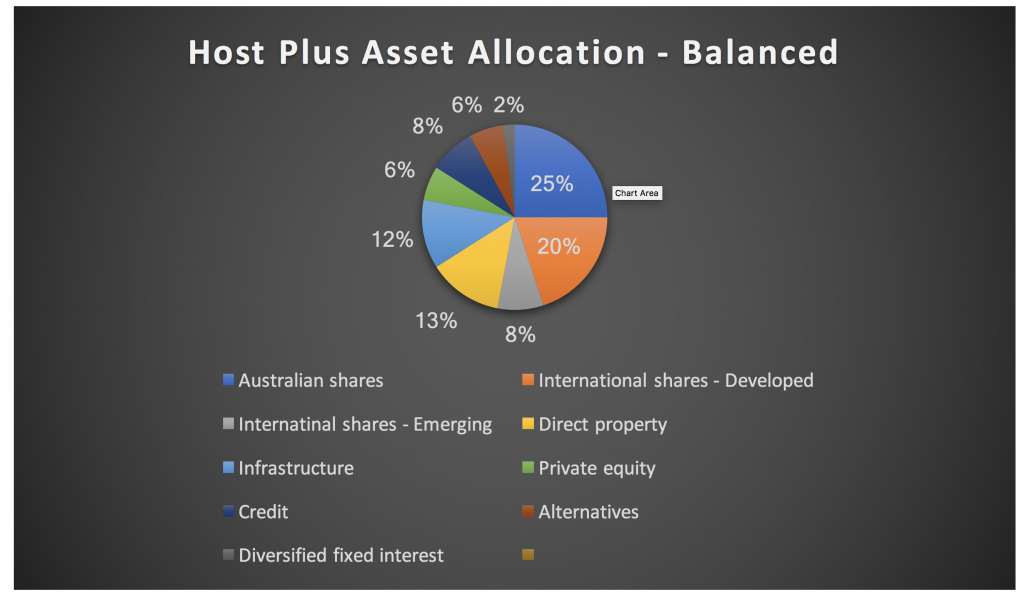
As an example, I have sourced the asset allocation for the HostPlus Balanced Fund below. This strategy seeks to employ active managers across a number of asset classes to achieve its objective of CPI plus 3 per cent per annum on average over 10 years. Interestingly, Canstar defines “Balanced” in the context of asset allocation in Superannuation Funds as “a reasonably even mix of safe and risky asset classes, good for someone who wants higher returns but less risk.”[1] A reasonable allocation, in my experience, would be an allocation of growth to defensive assets of 60-50 per cent/40-50 per cent respectively. However, when summing the asset allocation of the HostPlus Balanced Fund it is apparent it has a very sturdy lean towards growth assets of 90 per cent/10 per cent to defensive by traditional class definitions.
Source: Host Plus
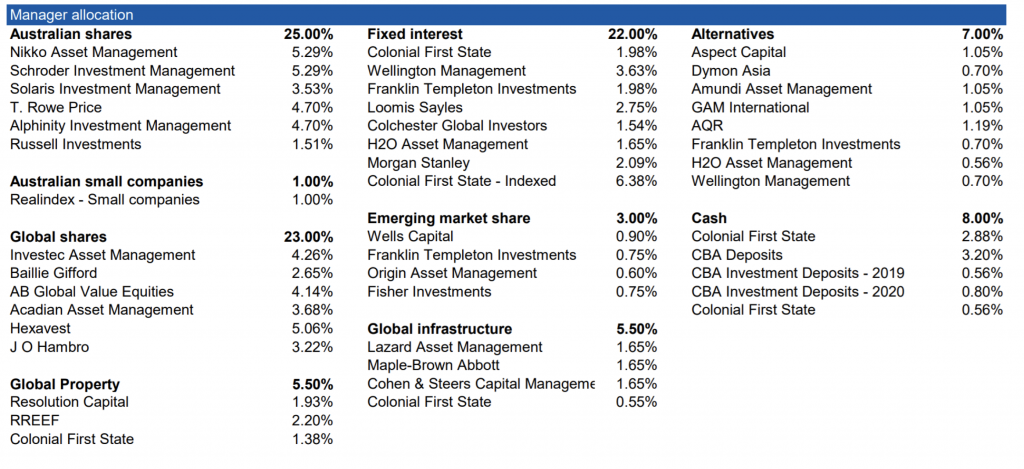
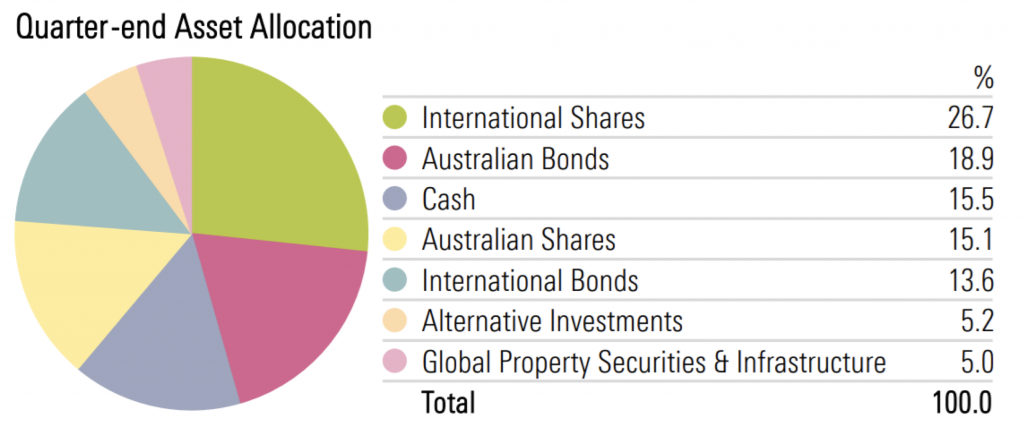
By way of comparison, I have also sourced the asset allocation below for the Colonial First State FirstChoice Balanced Fund and the Morningstar Balanced Fund. Like the HostPlus Balanced Fund, both strategies also seek to employ active managers under their investment mandate with slightly different objectives. The Colonial First State Fund aims outperform the option’s composite benchmark over rolling three-year periods before fees and taxes, and from an asset allocation perspective has a growth/defensive split of 70 per cent/30 per cent respectively. Conversely, the Morningstar Fund aims to outperform the SAA weighted composite return of the sector benchmarks over 5 to 7 years and is clearly underweight growth assets relative to HostPlus and Colonial First State, with a growth/defensive split of 52 per cent/48 per cent respectively.
Source: Colonial First State
Source: Morningstar Investment Management Australia
Putting it together
It is apparent there is varying industry definitions around what asset split constitutes “Balanced” and what you would in fact define as a growth and defensive asset in the first instance.
Ultimately both have significant implications for return comparisons, as strategies with a higher net growth asset allocation would have naturally outperformed over the last decade.
Exploring this further, property and infrastructure are assets, some may believe fall on the cusp of growth/defensive, but as we have seen locally (and globally), property prices are not immune to volatility and infrastructure can also experience swings depending where you are at in the interest cycle.
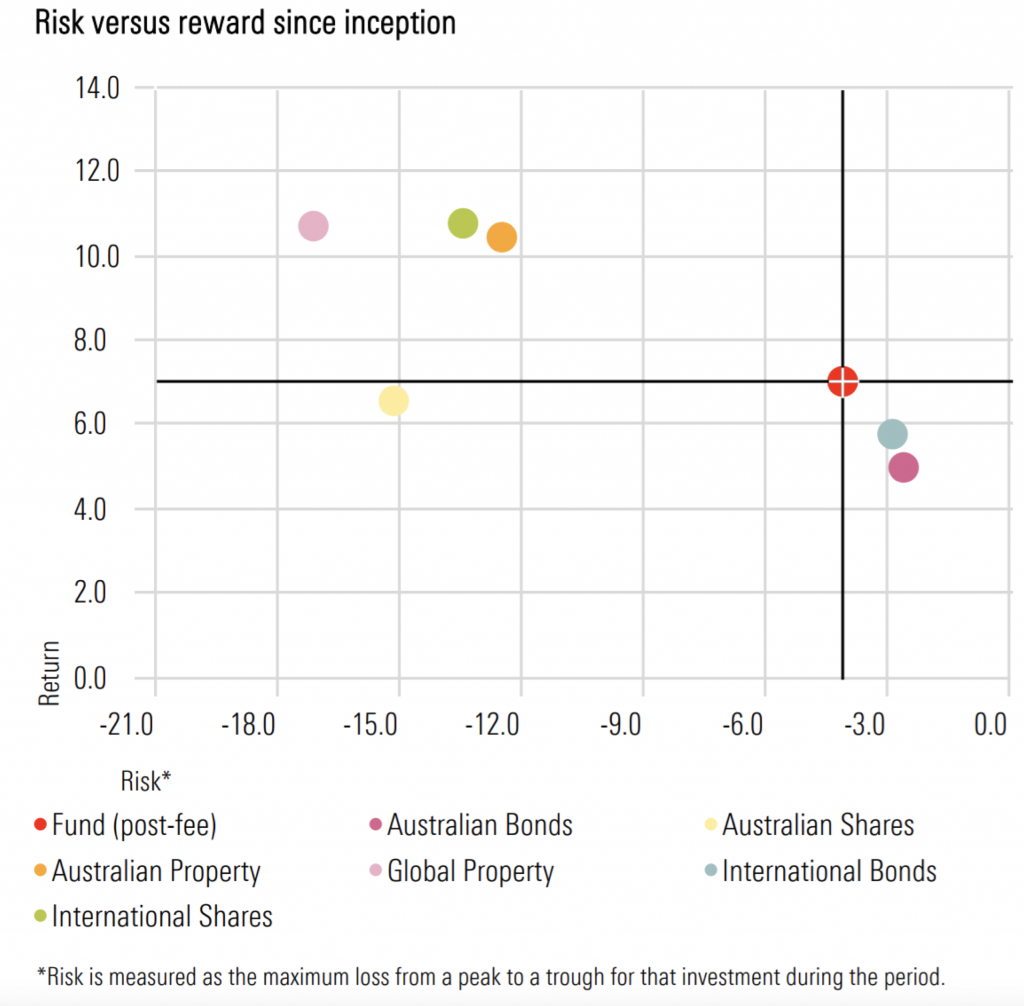
Morningstar have also done some work on the risk versus reward outcomes of these asset classes relative to their average return and drawdown since 1 January 2010. The way you would read this chart is the further up and to the right of the chart you are, the better the result is from a risk/reward perspective. As it illustrates, property (both local and global) does have similar risk/reward outcome to that of shares over this time period, particularly when compared to that of bonds.
Source: Morningstar Investment Management Australia
Does that mean you should not invest in an industry fund at all? I am not concluding this, but rather challenging individuals to think about understanding what underlying assets drive the returns of a multi-asset fund, or in fact in any fund you are reviewing.
As above, the key is to make sure you are comparing like for like from a growth/defensive allocation perspective, and also be mindful of comparing returns over common periods.
To aid investors, the one piece of advice I can reflect on when comparing funds is that of our Chief Investment Officer at Montgomery Global in Andrew Macken, “to outperform the equity market, one needs to invest – in a fairly concentrated way – with a small number of talented and disciplined active fund managers that follow a process which is logical and clearly understood by the investor.”
[1] (Source: https://www.canstar.com.au/superannuation/asset-allocation-superannuation-funds/).


Hi Roger
Thank you so much for offering to help with this. I currently own shares in all three and would like to get an indication of whether I should buy more.
At this stage I have only done the analysis for Platinum, so I’ll use that. I obtain all my numbers from the Morningstar Quantative analysis available from Commsec. I’m also considering purchasing the Skaffold software (I’m assuming it may do most of this hard work for me, but not sure).
Here are the numbers:
Shares on issue – 586679K
Beginning equity – $335,074K
Ending Equity – $335,179
Stated ROE – 57.2%
Stated EPS – 0.32
Stated Dividend per share – 0.31
Calculations:
Equity per share- $0.57
NPAT – $191,594K
Payout ratio – 96.88%
Calculated ROE – 57.17%
Investor required return – I’ve used 12%
Calculationsfrom tables:
Get table 1 data – 4.375
Get table 2 data – 14.493
Calculation 1 – $2.42
Calculation 2 – $0.28
Intrinsic value – $2.70
Morningstar Fair Value – $6.59
Current price $4.98
Maybe I have misinterpreted the calculation somewhere or my inputs are wrong somewhere.
Other calculations I have done seem more reasonable, ie The Reject Shop $3.86, Telstra $2.73
Kind regards
Stewart.
I think your issue is that your RR is way too high for a business of this quality. And especially when globally rates are so low. You are simply being too greedy requiring a 12 per cent return. Having said that, fund managers are leveraged to the vicissitudes of the stock market. What I mean by that is if the stock market falls in a heap, these companies fall in an even bigger heap. In a market correction, its not inconceivable to see $2.70 again that would be a 50% decline, which is not completely impossible. Of course you can’t go investing by waiting for crashes…but having some cash to take advantage is not silly either…Most importantly, keep in mind, as I mention in Value.able, your job in estimating intrinsic value is not to try and get a number that is close to the price. That would defeat the purpose.
Thank you Roger. I see what you mean. 12% for this particular company is too high (might have been more relevant in 2010), but now with lower interest rates, it’s less realistic. I’ll try a lower RR.
I’ve read your book from cover to cover and now refer to different parts of it every day and I must say that it is evolving the way I think about the markets and my confidence and knowledge is improving daily.
Thank you once again
Kind regards
Stewart
Delighted to hear it Stewart.
Hi
I have a question about Value*able. How would you value Financial stocks such as Platinum Asset Management and Macquarie bank and Challenger ?
Using your techniques in the book, I get a valuation for Platinum of around $2.70 whereas Morningstar Quantative give it a”fair value” of $6.59 as of 15th October.
I assume the capital requirements for Financial institutions come into it, but I’m a bit lost.
I’m really trying to use your valuation model, so any insight you could share to help make me a better investor would be greatly appreciated
Kind regards
Stewart Crammond
Hi Stewart, lets go through an example together. Can you upload here your assumptions for, say, Challenger?
Hi Roger
Thank you so much for offering to help with this. I currently own shares in all three and would like to get an indication of whether I should buy more.
At this stage I have only done the analysis for Platinum, so I’ll use that. I obtain all my numbers from the Morningstar Quantative analysis available from Commsec. I’m also considering purchasing the Skaffold software (I’m assuming it may do most of this hard work for me, but not sure).
Here are the numbers:
Shares on issue – 586679K
Beginning equity – $335,074K
Ending Equity – $335,179
Stated ROE – 57.2%
Stated EPS – 0.32
Stated Dividend per share – 0.31
Calculations:
Equity per share- $0.57
NPAT – $191,594K
Payout ratio – 96.88%
Calculated ROE – 57.17%
Investor required return – I’ve used 12%
Calculationsfrom tables:
Get table 1 data – 4.375
Get table 2 data – 14.493
Calculation 1 – $2.42
Calculation 2 – $0.28
Intrinsic value – $2.70
Morningstar Fair Value – $6.59
Current price $4.98
Maybe I have misinterpreted the calculation somewhere or my inputs are wrong somewhere.
Other calculations I have done seem more reasonable, ie The Reject Shop $3.86, Telstra $2.73
Kind regards
Stewart.