Airlines
-

MEDIA
How can the Biggest not be the Best?
Roger Montgomery
March 31, 2012
Roger Montgomery expounds upon his Value.able investing approach to illustrate how Big does not mean Best when choosing companies in this Australian article published on 31 March 2012. Read here.
by Roger Montgomery Posted in Airlines, Companies, In the Press, Investing Education.
- save this article
- POSTED IN Airlines, Companies, In the Press, Investing Education
-
Will Qantas be Taken Over?
Roger Montgomery
September 1, 2011
 Who would have thought a little comment at the end of my 17 August Value.able column for Alan Kohler’s Eureka Report on Qantas’ strategic direction announcement would cause such a stir!
It appears I wasn’t the only Value.able Graduate wondering aloud about the coincidental timing of the strategic change of direction, coming as it did whilst the share price was trading at near record lows.
My Value.able column started like this: “Sick of losing money, Qantas CEO Alan Joyce revealed a long-overdue change of strategy for the airline earlier this week, which included cutting jobs, delaying the delivery of six A380s until 2019, buying smaller aircraft, launching two new Asia-based airlines and an attempt to turn around the fortunes of Qantas International.”
And ended like this: “This may not disturb parties that have taken notice of the share price trading below NTA and considered mounting a takeover. You may recall that back in 2007 a consortium that included former CEO Geoff Dixon and former chairman Margaret Jackson had a bid of $5.45 share on the table. At yesterday’s closing price of $1.525 I think it’s safe to say they dodged a bullet.
“If there’s a way to get around the Qantas Sale Act and increase aircraft utilisation rates with an offshore hub, I reckon someone out there in the world of institutional finance has thought of it and run the ruler over Qantas
“…if there was ever a second tilt at Qantas, now would be as good a time as any…”
Have a quick look at the Balance Sheet.
Ignoring the $470 million ‘investments accounted for using the equity method’, QAN has twenty billion of assets (only $593 million are intangibles – landing slots, brand and software). There is $3 billion of cash and $13.8 billion of property, plant and equipment. Now add to that $14 billion of liabilities, some of which is represented by Redemption Revenue*, a portion of which may never be claimed.
For the moment, put aside the Qantas Sale Act (a small thing to do here because it suits this discussion!), now imagine…
You mount a bid for $3.5 billion (funded largely by the cash in the company’s bank account). You sell all the planes, the property and all the equipment to pay off the liabilities, but keep the frequent flyer business, which then cost you nothing.
While it is true my scenario is embarrassingly simplistic (and not nearly as obvious as bidding for ING during the depths of the GFC) it may also be true that the most profitable frequent flyer program in the world (and Qantas’ most profitable Operating Segment) could be in the sights of an audacious bidder.
Let’s compare the Revenue, Earnings Before Interest and Tax (EBIT) and resulting EBIT Margin of Qantas’ four core operating segments:
I know which segment I want to own!
In 2007 Qantas was the target of a takeover attempt by APA (Airline Partners Australia) – a consortium put together specifically for that purpose. They were willing to pay $11 billion.
At the time, fears around the impact of a highly leveraged owner on Australian superannuation funds were added to the national interest concerns. The bid was not supported by employees or the community. Interestingly, the government of the day didn’t intervene in the bid because of undertakings that the company would remain Australian owned and headquartered in Australia. We are a proud nation.
A bid today at, say $4.5 billion, and with the same undertakings, would either make the current bidders look very wily, or those involved in the previous attempt very silly.
Many analysts now have buy recommendations on Qantas. Whilst I agree that the shares are at a discount to tangible equity, I don’t believe the discount is as great as being stated. This is because retained earnings in equity were never really earned. The economic profit of the airline is, as I have stated on many occasions over the years, much lower than the accounting construct that produced the retained earnings entry. But a discount to NTA does appear to exist.
If you were a bidder, and can overcome all the obstacles, with the share price well below NTA and the imminent prospect of the company committing to acquire another 100 planes, you’d want to get a move on.
Of course this is a purely economic discussion and does not take into account the impact on the jobs and livelihoods of QAN’s 34,000 staff and their families. Nor have I taken into account Australia’s national interest.
There haven’t been many occasions when QAN shares have traded below my estimate of the company’s Value.able intrinsic either.
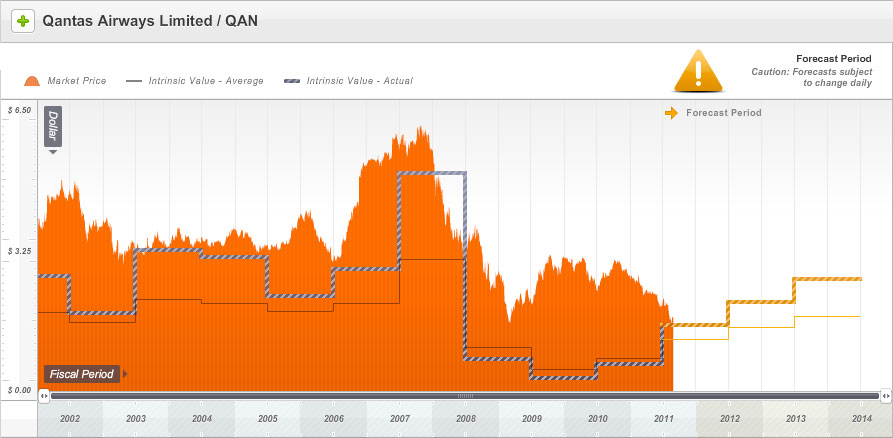
Ten days ago Qantas was trading at intrinsic value. Based on recent results and current expectations, our estimate of intrinsic value is forecast to rise by as much as 30 per cent over the next three years.
Sneak Peek #2: Ten years of historical intrinsic value and three years of forecast valuations for Qantas, compared to the current market price. Why is the price chart orange, I hear you ask? Because Qantas scores a B for quality. In our next-generation A1 service B = Adequate Quality and Adequate Quality = orange. Amazing, incredible, simple.
There are just two requirements to ensure you receive an invitation to become a founding member of our next-generation A1 service.
1. Read Value.able
2. Change some part of the way you think about the stock market
You may also like to submit your photograph to the Value.able Graduate album at my Facebok page, however this is optional. If you haven’t yet secured your copy of Value.able and joined the Graduate Class, click here.
Posted by Roger Montgomery and his A1 team, fund managers and creators of the next-generation A1 stock market service, 1 September 2011.
*The company’s notes states; “Unused tickets are recognised as revenue using estimates regarding the timing of recognition based on the terms and conditions of the ticket. Changes in these estimation methods could have a material impact on the financial statements of Qantas.” Some have suggested that more can be made from unused tickets than those actually claimed/uplifted.
Redemption revenue received for the issuance of FF points is deferred as a liability (revenue received in advance) until the points are redeemed or the passenger is uplifted in the case of flight redemptions. Redemption revenue is measured based on management’s estimate of the fair value of the expected awards for which the points will be redeemed. The fair value of the awards are reduced to take into account the proportion of points that are expected to expire (breakage). The accounting steps are [a current liability if they will be earned within one year] debit to the asset Cash for the amount received and a credit to the liability account such as revenue received in advance.
As the amount received in advance is earned, the current liability account will be debited for the amount earned and the Revenues account reported on the income statement will be credited. This is done through an adjusting entry.
by Roger Montgomery Posted in Airlines.
- 39 Comments
- save this article
- POSTED IN Airlines
-
How much capital intensity does it take to sell seats?
Roger Montgomery
August 30, 2011
 Did you know some of Qantas’ planes are more than twenty years old? And our estimate is that they fly, on average, 14 hours per day. The rest of the time they mimic that expensive bit of fashion in your garage, earning no income. That garage/hangar time has expensive ramifications for the economics of airlines, just as your decision to buy an expensive but garaged ‘fashion’ item has expensive ramifications for you.
Capital-intensive businesses, such as airlines, erode shareholder wealth. Inflation ensures their maintenance and replacement is a significant proportion of cash flow, which could otherwise be paid out to shareholders. Parts plus labour, which protect the business assets from wear and tear, actually causes wear and tear on shareholders’ funds.
Raising capital and increasing debt, has hitherto been easy for Qantas, but the market is slowly coming to the realisation that it cannot continue. The market capitalisation of Qantas – the ‘value’ the market ascribes – is less than all the equity that the company has raised – much less.
As a result of the market’s slow migration to understanding the economics of airlines, fresh management have had to respond quickly.
The best measure of economic performance is Return on Equity (ROE). This year QAN achieved a ROE of just over four per cent. Meanwhile, Oroton shareholders have been enjoying eighty per cent returns. Did you know there are 267 companies that earn more than 15 per cent returns on equity?
The business of selling seats is an expensive one for Qantas, and while the business of selling the hope-of-getting-a-seat (the Frequent Flyer program) is extremely profitable, owning planes means the cash is always inhibited – it can’t be distributed to shareholder owners.
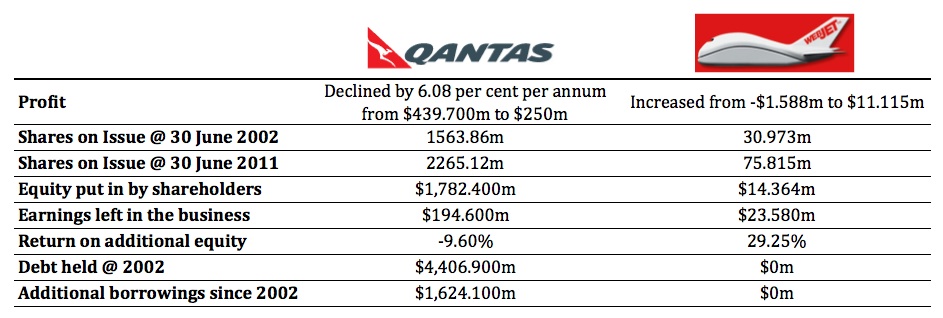
Qantas however isn’t the only seller of seats on planes. Indeed there are businesses that sell seats on planes and they don’t have any planes. Let’s compare two seat-sellers: Qantas and Webjet.
I believe the very best businesses online are lists – lists of jobs, lists of apps, lists of songs, lists of cars, lists of houses, list of flights and lists of seats. What is particularly attractive is that a business with a list of seats doesn’t have any planes. Sure its revenue is going to be lower, but what about its profit?
Let’s compare…
Now, lets take a look the economics of these businesses over the past ten years.
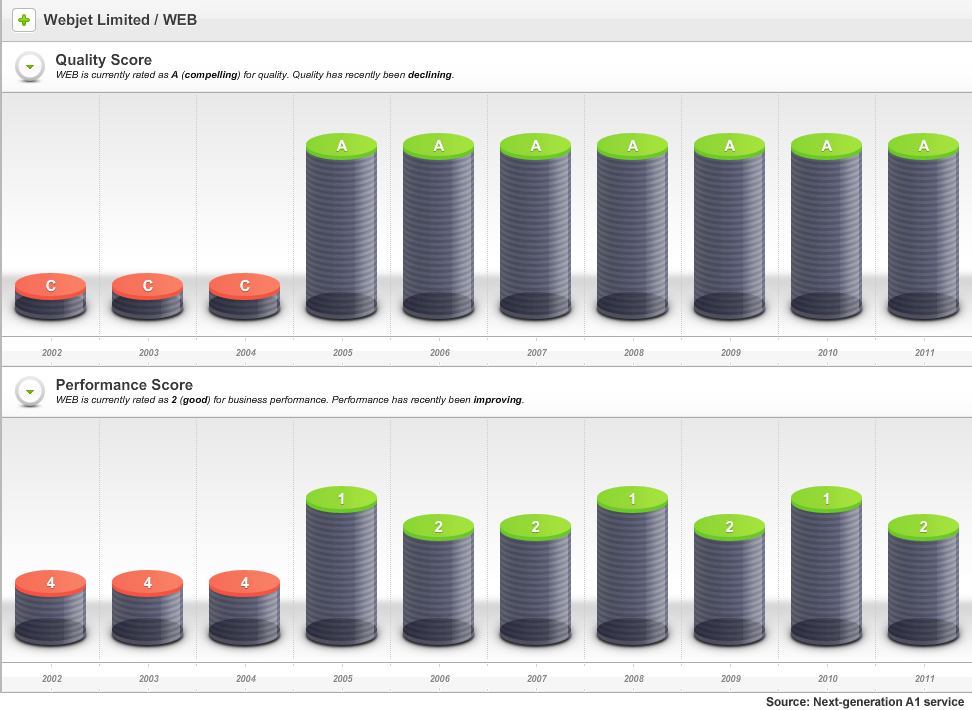
As the following sneek peek charts from our soon-to-be-released next-generation A1 stock market service display, Webjet has scored, on average, an A2 since 2005.
In this example, the Quality Score information tells us that something dramatic happened in the 2004/2005 financial year.
Webjet was once called Roper River Resources Company and in July 1999 the shares, under the ASX code; RRR, were trading at 25 cents. By March 2000 – near the peak of the internet bubble – RRR shares were trading at $1.38.
The reason is now obvious, although at the time it may have been a bit of a mystery.
In January 2000, Roper received a ‘speeding ticket’ from the ASX to which it responded on 14 January with the following statement:
“1. There are no, matters of importance, about to be released to the market.
“2. The Company is not aware of any information to explain the recent trading in the shares.
“3. The Company can offer no other explanation for the price change and increase in volume in the securities of the Company.”
“4. I confirm that the Company is in compliance with the listing rules, in particular, listing rule 3.1.”
On 27 January 2000 however – less than two weeks later – Roper River Resources (ASX:RRR) announced it was issuing 50 million shares to acquire Webjet Pty Ltd.
By June 2004 the shares were still trading at 15 cents, however the company announced the previous October that it was trading in the black for the first time. By November 2004, it was reporting 400 per cent monthly increases in sales. Almost every month to its full year results in June 2005, it continued to report 400 plus percentage increases in monthly sales.
And in that year Webjet’s Quality Score jumped from C4 to A1. As you can see, Webjet has maintained an A1 or A2 quality rating since.
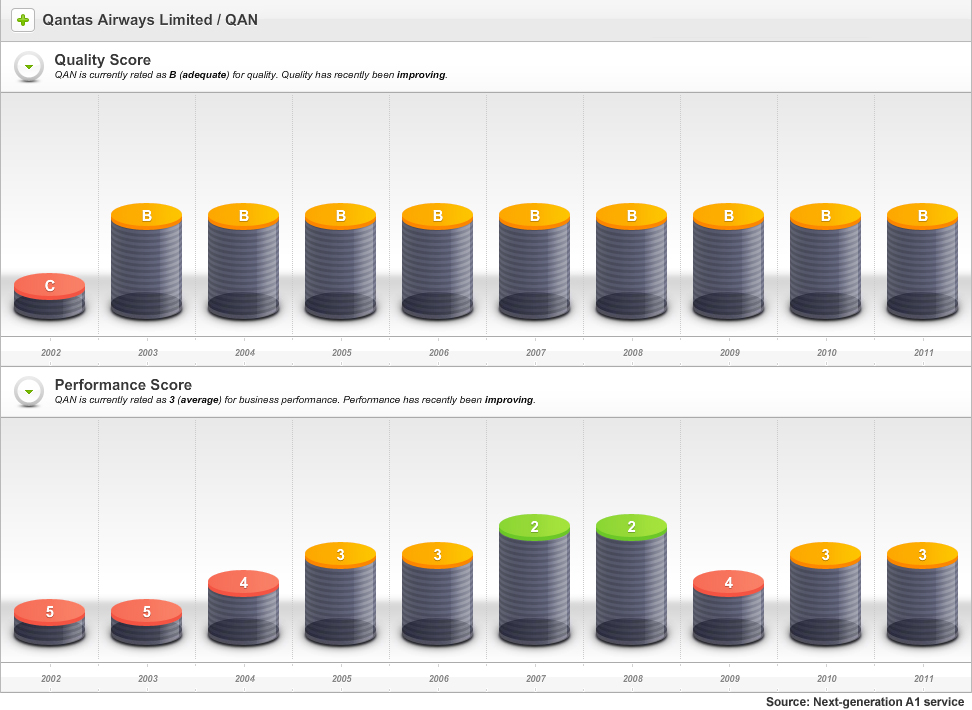
By comparison, Qantas’s Quality Score profile has been more marginal. This should be unsurprising to many, if not most Value.able Graduates, who understand the downside of capital intensity. Lots of property plant and equipment results in more equity for a given profit, and that means lower returns.
So, what do you think?
With reporting season about to end, your mission, if you choose to accept it, is:
Source the latest Annual Report for each business in your portfolio. Go to the Balance Sheet and under ‘Non-Current Assets’ find ‘Property, Plant and Equipment’.
If you have any, how many capital-intensive businesses are hiding in your portfolio?
Making this process simple and easy is something we have been working on for you. We created our next-generation A1 service because we wanted to make finding extraordinary companies offering large safety margins easy. And, of course we love investing. The above graphics are just one
It’s an A1 service that is like nothing you have ever seen before.value
Value.able Graduates – your invitation to pre-register is coming soon.
If you haven’t graduated to guarantee your invitation, click here to order your copy of Value.able immediately. Once you have 1. Read Value.able and 2. changed some part of the way you think about the stock market, my team and I will be delighted to officially welcome you as a Graduate of the Class of 2011 (and invite you to become a founding member of our soon-to-be-released next-generation A1 service).
Posted by Roger Montgomery and his A1 team, fund managers and creators of the ext-generation A1 stock market service, 30 August 2011.
by Roger Montgomery Posted in Airlines, Companies, Insightful Insights, Value.able.
-
…You can’t touch this?
Roger Montgomery
June 13, 2011
“Yet you do not know about what may happen tomorrow. What is the nature of your life? You are but a wisp of vapor that is visible for a little while and then disappears“. James 4:14
“Suddenly a mist fell from my eyes and I knew the way I had to take.” Edvard Grieg
“Fog and smog should not be confused and are easily separated by color.” Chuck Jones
With apologies to 90’s rapper M.C Hammer, today I plan to lift the lid, ever so slightly, on a misconception about the value of tangible assets. I’ll throw in a few Value.able intrinsic valuations for you too.
Were you as fascinated recently, as I was, to read Harvey Norman suggesting that the price premium to book value of JB Hi-Fi compared to that of itself was unjustified? The company pointed out – and allow me to paraphrase – that the market capitalisation of JB Hi-Fi ($1.9 billion) against just $365 million of book value is high, when Harvey Norman’s market capitalisation is $2.7 billion and its book value is expected to be $2.2 billion at the end of this financial year.
The attachment to physical assets held by many is not unusual, nor is the belief that intangible assets are akin to a puff of smoke. Premiums to book value however are justified when that ‘book’ generates above average rates of return. And it is assets of the intangible variety – the economic goodwill (rather than the accounting variety) – that are more valuable anyway. Physical assets can be replaced, imitated and replicated. Any competitor (with deep enough pockets) can purchase almost all of them. Ultimately, any unusual returns these generate will be competed away as competitors secure the same machines, tools, equipment etc. Many in the printing game experience this phenomenon. A new machine gives them a marginal advantage only for as long as it takes their competitor to make the same investment.
Assets of an intangible nature are less easily copied and so high rates of return can be sustained longer, and are therefore worth more.
A company’s book value is the net worth of its assets. Book value is made up of both tangible assets and intangible assets. Tangible assets are physical and financial and include property, plant & equipment, inventory, cash, receivables and investments. Intangible assets aren’t physical or financial and may include trademarks, franchises and patents.
To demonstrate the difference in value between intangible and tangible, have a look at Google; That company’s market capitalisation is US$165.5 billion and yet its book value is just US$48.6 billion. Its price to book value is 3.42 times. JB Hi-Fi’s price to book value is 5.2 times and Harvey Norman’s is 1.22 times. But Google’s ‘book’ generates returns of 19.16%, JB Hi-Fi; 41.5% and Harvey Norman; 11.6%. There is indeed a relationship between the price premium to ‘book’ and the profitability of that ‘book’ (‘ROE’). A business is worth much more than its net tangible assets when it produces profits well in excess of market-wide rates of return.
I wrote about the capital intensity of airlines in Value.able (re-read Pages 60-63, 122, 164, 172-3), so you should know my thoughts about this already (You can also read any of these articles and transcripts for a refresher: Taking-off or crash-landing?, Qantas cuts costs to stay in profit, Qantas cuts staff, flights to counter fuel price hit and Flights reduced, jobs cut at Qantas).
When it comes to physical assets, less is more. For a business to double sales and profits, there is frequently the requirement to increase the level of physical assets. The higher the proportion of physical assets compared to sales that are required, the less cash flow available to the owner. This is the antithesis of the intangible-heavy business that continually produces profits without the need to spend money on maintenance, upgrades or replacements.
Let me demonstrate with an admittedly rudimentary example. Take two companies Rich Pty Limited and Poor Pty Limited. Both companies earn a profit of $100,000. Rich Pty Limited has net assets of $1 million. Intangible assets, such as patents and a brand, represent six hundred thousand dollars while physical assets, including machinery running at full capacity and inventory, represent $400,000. Poor Pty Limited also has a net worth of $1 million, but this time the intangible/intangible mix is reversed and eight hundred thousand dollars represents tangible assets and $200,000 is intangible.
Rich P/L is earning $100,000 from tangible assets of $400,000 and Poor P/L is earning $100,000 from tangible assets of $800,000.
If both companies sought to double earnings, they may also have to double their investment in tangible assets. Rich P/L would have to invest another $400,000 to increase earnings by $100,000. Poor P/L would have to spend another $800,000.
For many investors a large proportion of physical assets – also reflected in a high NTA – is seen as a solid backstop in the event something catastrophic should befall a company. I would suggest that the opposite may just be true. A high level of physical assets may be a drag on your returns.
Physical assets are only worth more if they can generate a higher rate of earnings. Any hope that they are worth more than their book value is based on the ability to sell them for more, and that, in turn, is dependent on either finding a ‘sucker’ to buy them or a buyer who can generate a much higher return and therefore justify the higher price.
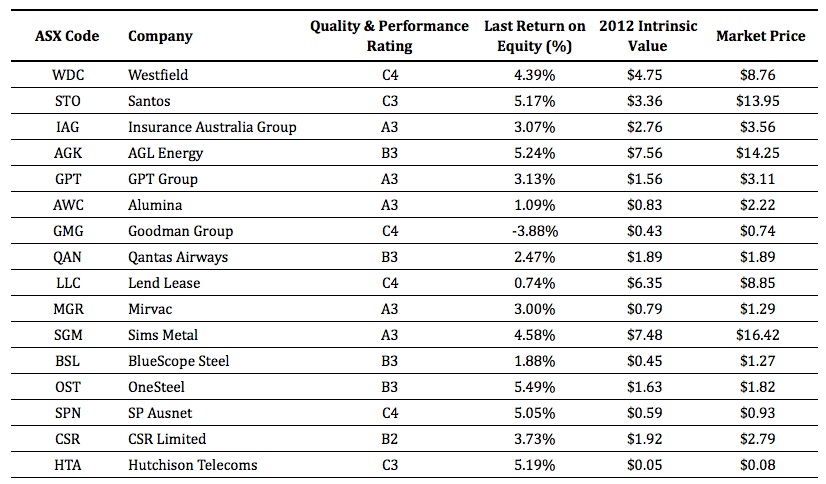
With these ideas in mind, its worth looking at a list of companies that further investigation may show have very high levels of tangible assets compared to their profits. Let’s also throw in those companies that have highly valued intangible assets too. If they are generating low returns on these, the auditors should arguably take a knife to their stated ‘book’ values.
Starting with those companies whose market captitalisation is more than $1 billion (156), I then ranked them by return on equity (return on book value) in ascending order. 49 (31 per cent) companies generate returns less than your bank term deposit. The 16 largest (based on market capitalisation) companies with low ROE, possibly indicating either high levels of tangible assets or possibly overstated intangible assets carried on the balance sheet, are:
I have excluded resource companies. For while there are plenty that qualify, their returns are dependent on commodity prices.
Something to remember about the Quality & Performance Rating…
Rated A1 to A5, B1 to B5 and C1 to C5, every listed company is rated based on a series of over 30 discrete metrics, measured at both a point in time and over time. Most importantly, the Quality and Performance Rating is applied without any subjectivity. All companies are judged according to the metrics they generate. A1s have the lowest probability of a liquidation event. “Lowest probability” however doesn’t mean a liquidity event won’t occur. It just means far fewer A1s will have a liquidity event imposed on them compared to C5s. A liquidity event includes a capital raising, debt default or renegotiation, administration, receivership etc. An A1 company could of course raise capital if it needs to fast track construction of a new factory. MCE is an example of a high quality company whose cash flow has needed supplementation for this reason. Sticking to A1s and avoiding C5s should, over time, produce better returns. I demonstrate in the following chart:
The above chart shows the performance of a portfolio of the 20 biggest companies listed on the ASX rated ‘A1’. The red line is the poor old ASX 200.
There is merit with sticking to A1s (just as those who like the taste of Coca-Cola don’t settle for Pepsi). My team and I are fine-tuning something that will make the identification of A1s extraordinarily simple. So ignore those ‘Beat-the-tax-man’ pre-June 30 ‘special’ offers from various investing experts and other ‘helpers’. Avoid the temptation of an extra one, two or three month ‘subscription’, a show bag full of tips, a free magazine, DVD, or even a set of free steak knives.Wait for an A1 opportunity instead. Your patience will be rewarded.
Posted by Roger Montgomery and his A1 team, fund managers and creators of the next-generation A1 service for stock market investors, 13 June 2011.
by Roger Montgomery Posted in Airlines, Companies, Insightful Insights, Value.able.
-
What do you think of the QAN, JBH and ITX results Roger?
Roger Montgomery
August 12, 2010
 Here we are in the midst of reporting season and there are some reasonably predictable results. Qantas reported a profit today that was less than a quarter of its profit more than ten years ago. The airline reported a $112 million profit but that was boosted by $1 billion of revenue from its Frequent Flyer program and a $300 reduction in employment costs. For those of you interested in the real numbers, the company actually lost $302 million (see my chapter in Value.able on cash flow) and this can be explained by the very wide gap between the depreciation item in the profit and loss statement and the real expenditure on property plant & equipment. Depreciation looks backwards, but new planes cost more.
Separately, JB Hi-Fi’s result was excellent but my concern is that its $94 million of cash flow (of which $67 million was allocated to dividends and $20 million allocated to paying down debt) is superfluous to its needs. Take a look at the biggest asset on the balance sheet – Inventory of $334 million. Then take a look at the creditors item in the current liabilities section. Almost the same amount!
Think about it this way; the suppliers are funding the inventory so the company doesn’t even need cash to pay have the stuff it sells and that are on its shelves. Actually it really does, the gap is about what is left over once we subtract the debt repayment and dividends from the cash flow. It is small though. Once the debt is gone and the cash keeps growing it may do something that could harm intrinsic value.
Now don’t get me wrong; JB Hi-Fi is an amazing business that retained its A1 status in this result and the risk associated with its plans to roll out more stores is very low. I also think intrinsic value will continue to rise at a satisfactory rate. The concern for me with all this cash (and there is no evidence of it yet) is that the company increases the dividend payout ratio again. This would mean a reduction in the rate of growth of intrinsic value. It could stop being the “compounding machine” it has been to date. Return on equity also appears to be flattening, which could mean within the next few years, the valuation may plateau (but at a higher level than the current price).
On an unrelated issue, I note that back on 4 May 2010, I put together a list of the companies that I though represented the last of value in a blog post entitled Do these three companies represent the last of good value? ITX was one of the companies listed and I note the company has announced “itX confirms that it is in discussions with an interested party regarding a preliminary non-binding indication of interest to acquire 100% of the ordinary shares in itX.”
I’m pleased to strike another one up for the quality rating and valuation approach advocated here at my Insights blog!
Posted by Roger Montgomery, 12 August 2010
by Roger Montgomery Posted in Airlines, Companies, Insightful Insights.
- 29 Comments
- save this article
- POSTED IN Airlines, Companies, Insightful Insights
-
Is Qantas’s dividend-miss surprising?
Roger Montgomery
February 18, 2010
Qantas reported its half year profit today and the oft’ heard investor refrain “but Roger, its pays me a good dividend” was dealt a heavy blow with the company announcing no dividend would be paid for the half year.
As you all know by now, an airline profit is an accounting construct. If the depreciation charge was replaced by “a provision for replacement cost of aircraft” (my own accounting invention), the charge would be a lot higher and no profits would exist. Indeed, even though I have been saying this since the 90’s, it was evidenced again in Qantas’s half yearly report with $142 million of “additional depreciation”
So how are dividends ever paid?
A quick look at the debt and equity over the year reveals it is the charitable nature of banks and shareholders that keeps the planes in the air. As I write this, the total market value of the company is less than all the money that has been injected into it and left in it over the last decade and a half.
Can you believe a private equity group wanted to pay $11.1 billion for Qantas, or $5.45 per share? Can you believe that the stock market price went as high as $6.06, valuing the business momentarily at $12.3 billion? And they say the stock market and that its participants are rational!
The world’s airlines have accumulated aggregate losses of almost $54 billion over the last decade and in 2010 will lose another collective $5.8 billion[1]
Now don’t get me wrong. I am not saying Qantas isn’t a great Australian icon. Nor am I saying that the team isn’t doing a world-class job. Indeed, Qantas is regarded as the most profitable airline in the world. But you can see yourself that it would be very painful financially to own Qantas outright. From a purely capitalist perspective, I would rather own something else. A term deposit perhaps.
Here is a link to todays ABC Radio Interview about Qantas on The World Today: ABC RADIO qantas interview
[1] International Air Transport Association (IATA) Report 2009
Posted by Roger Montgomery, 18 February 2010.
by Roger Montgomery Posted in Airlines.
- 12 Comments
- save this article
- POSTED IN Airlines

