Can you boost returns by using the momentum effect?
One of the better-known market anomalies is the momentum effect. This describes the tendency for stocks that have recently performed well to have a better-than-average chance of continuing to rise. Can investors can profit from the momentum effect by staying with a trend until it stops?
To better understand this phenomenon, there are some simple analyses we can do to try to understand what is going on.
Firstly, let’s look at the time structure of the relationship between past returns and future returns.
We set as our universe the largest 250 ASX-listed companies by market capitalisation, and we examine these companies for the period from the start of 2002 up to the end of July 2019.
At each month-end during this period, we take the previous year of return performance[1]and slice it up into 26 smaller periods each lasting 10 business days (adding up to approximately 260 business days in a year).
Across our universe at each month end, we examine the relationship between the return performance in each slice and the return performance for the ‘future month’ (ie the month commencing at the end of our most recent time slice).
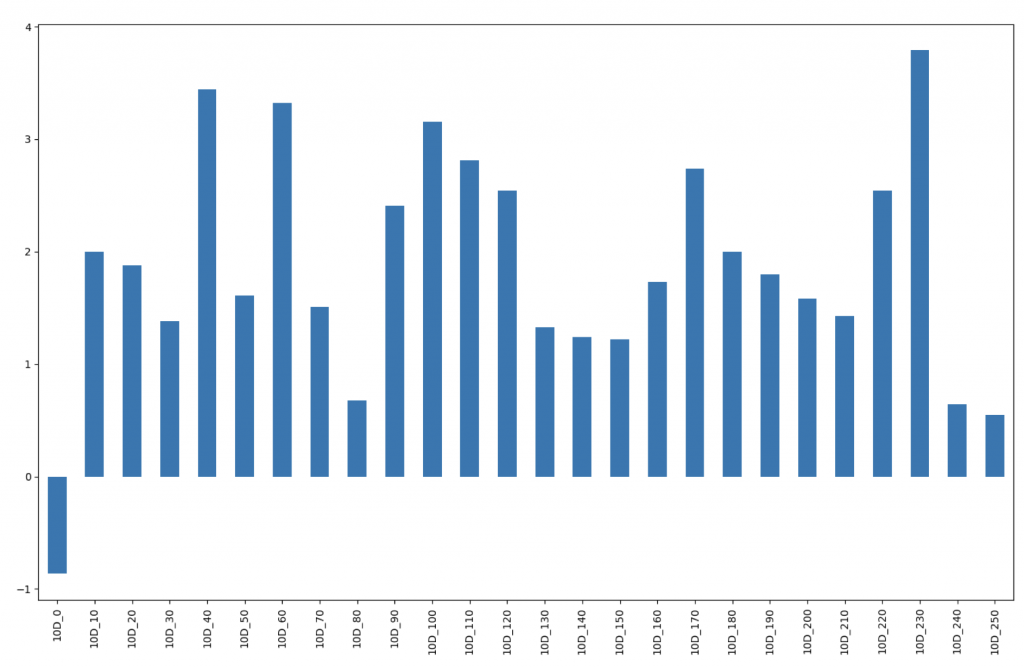
We do some processing on the data to separate signal from noise, and we express the results in terms of T-statistics, which indicate the strength of the statistical relationship relative to its estimated standard error (think of T-stat as number of standard deviations). The results of the analysis are set out below.
T-Statistic by Time Slice

Source: MIM
These results are quite striking. We see a negative relationship for the ‘zero’ time slice, which is the 10 business days immediately prior to the start of our ‘future’ month. For all the older time slices we see a positive relationship.
This is consistent with what the academic literature would lead us to think. Stock returns tend to show a short-term ‘mean reversion’ behaviour, where the strongest performers in the last (say) ten days might be expected to be the worst performers going forward, and a medium term momentum behaviour, where the strongest performers over (say) a 12-month period tend to be the strongest performers going forward.
The strength of this medium-term momentum effect in Australia has been surprising. Our analysis shows a positive relationship for every single 10-day time slice apart from the most recent one. This is a result that would be very unlikely to occur by chance.
The analysis suggests that you could create a good momentum signal by taking the last 12 months return performance, but ignoring the most recent few weeks, and this is exactly what investors who use this anomaly tend to do. Let’s construct a momentum signal on this basis and look a bit more closely.
Our momentum factor constructed in this way has an overall T-statistic of 5.2, which is a very strong result[2], but we can drill into this a bit deeper. Share market anomalies tend to work better at the smaller end of the market, and we want to know if our signal works across the market capitalisation spectrum, so let’s divide our universe into small and large companies (we split using the median market cap at each month end) and look at the results.
We find that in the small half of our universe the results are more impressive, as expected – we find a T-statistic of 6.1, compared with a more modest 2.8 for the large half. Still, overall this is pretty good – even in the larger companies, our momentum measure seems to have reasonable power.
Before getting too carried away, we should think about whether our signal retains its power today, or whether it might have decayed over time. Momentum is a well-known market anomaly, and a lot of investors use momentum signals of some kind, so it makes sense to be alert to the possibility of over-crowding.
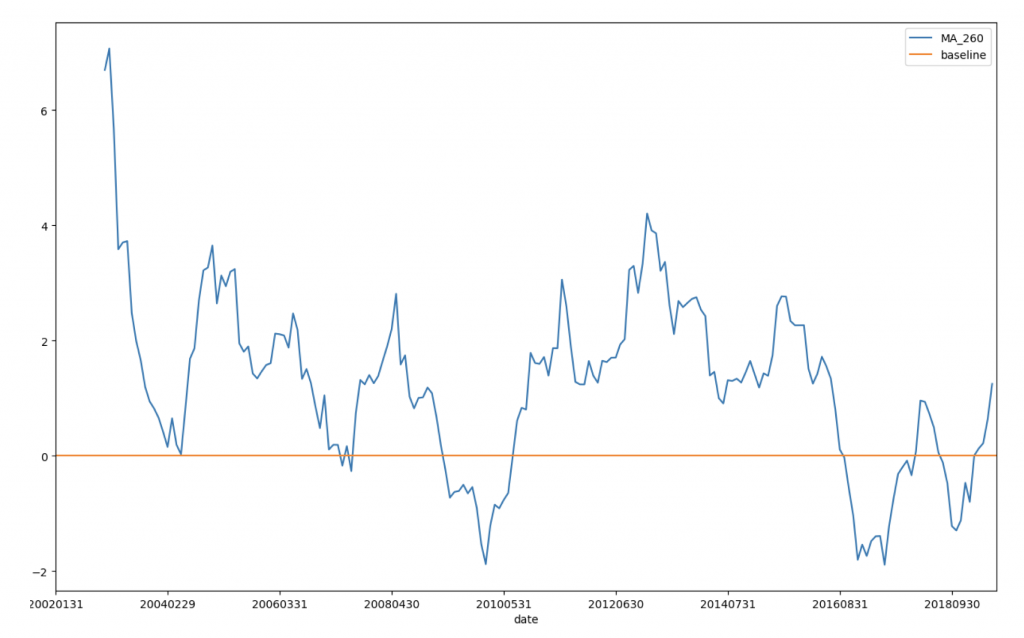
We can examine this by looking at the rolling 1-year average performance of our momentum measure over time. The results of this analysis are shown in the chart below.
12-Month Rolling Average T-statistic

Source: MIM
Here we can see some evidence that the future might not be as rosy as the past. Our momentum factor enjoyed some of its best performance in the early part of our time series and has delivered a net negative over the last couple of years.
We can explore this further by testing our factor against a global universe, and that analysis shows a broadly similar theme: strong results on average over time; a weaker run more recently; but with most markets appearing to now be back into positive territory.
It is important to note that stock selection factors like this inevitably go through cycles, and the most recent down cycle does not look particularly unusual. Probably a reasonable position to take is to expect that our momentum factor should deliver positive results on average going forward, but we should not expect these results to be quite as strong as the numbers in our back-tests suggest.
Of course, a better approach still is to try to find anomalies that are not well-known to other investors. At Montgomery, we invest a significant amount of time and effort into this type of research with a view to better understanding the markets we invest in, and continuously improving the decision-making of all of our funds.
[1]The T-statistic is larger than the numbers in our time slice chart because each of the time slices contains a smaller sample size and therefore offers lower statistical confidence.
[2]We take beta-adjusted excess returns as our measure of return performance.