Bored apes and bananas part. 2
If you haven’t yet, read Bored apes and bananas – Part 1
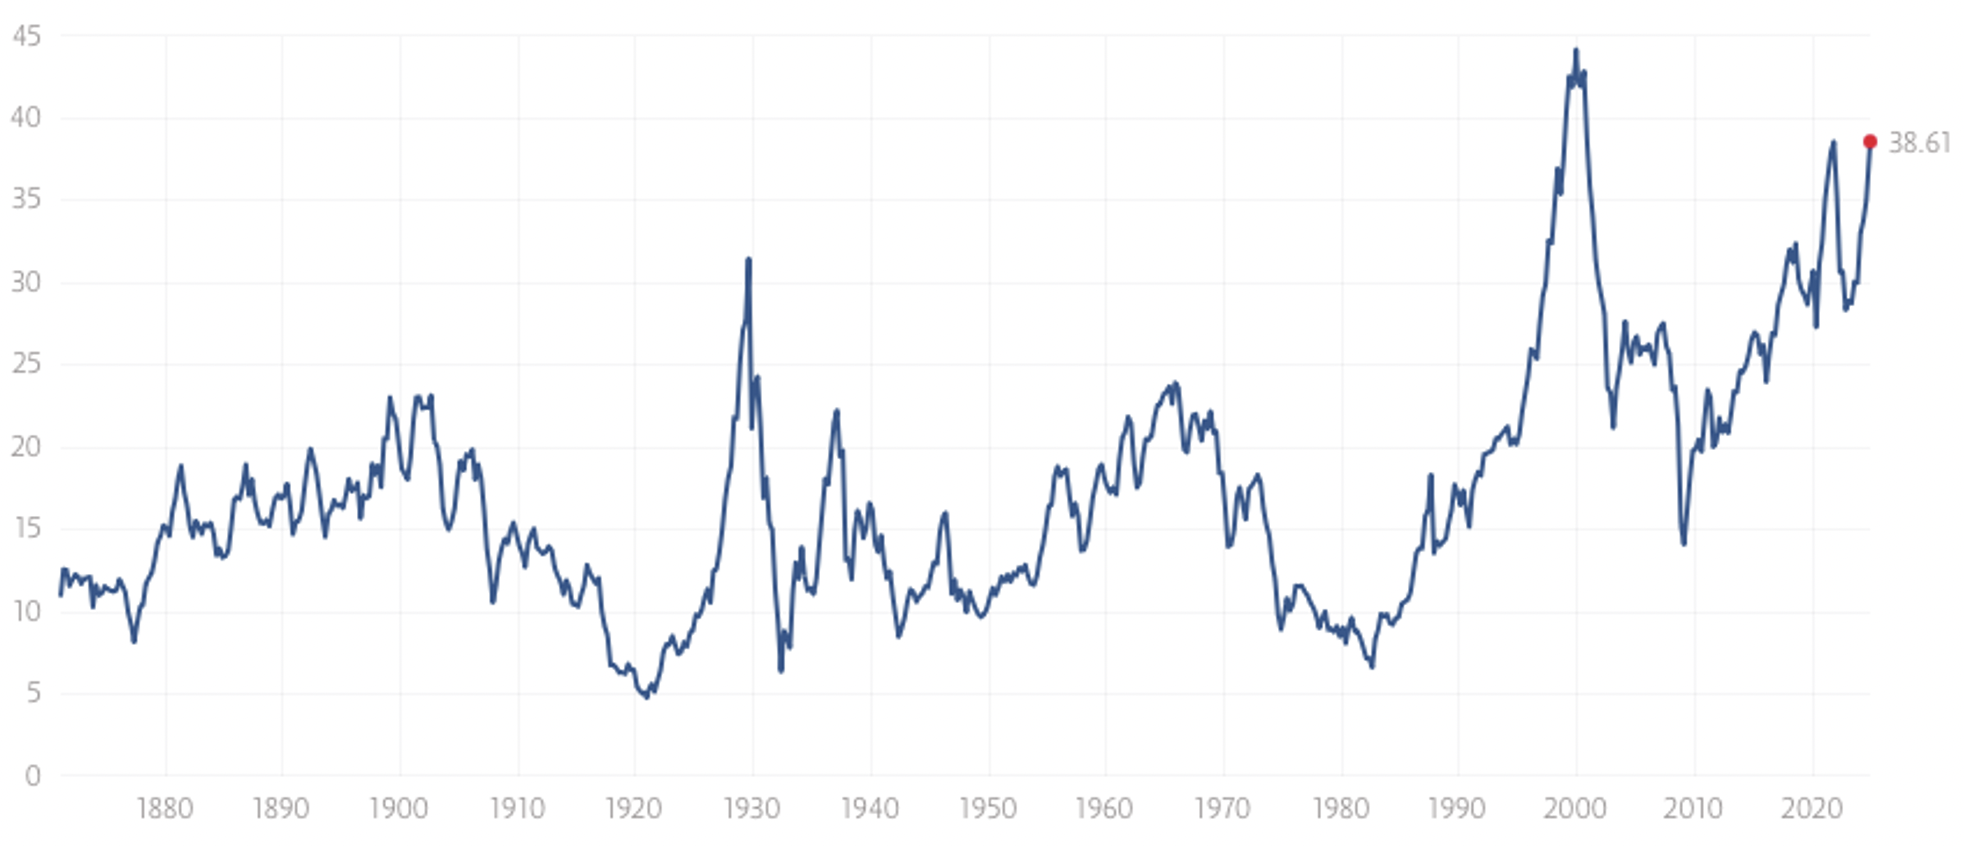
Since the beginning of the year, some commentators have voiced concerns that equity valuations have become historically stretched. Thanks to the rally in technology stocks, Wall Street’s major indices have displayed historically high valuation metrics such as the cyclically adjusted price-earnings (CAPE) shiller ratio.
Figure 3. S&P500 CAPE ratio

The problem with the CAPE Shiller price-to-earnings (P/E) ratio is that it takes the last ten years of inflation-adjusted earnings and compares those earnings to the current price. Of course, in the last ten years, we have had a notorious black swan event, even that depressed earnings, bringing down the ten-year average of earnings and consequently driving the CAPE ratio higher than it otherwise would be.
Meanwhile, the world is faring much better, earnings are growing, the U.S. economy is robust and corporate profit margins are healthy.
By way of example, while the S&P 500 Index returned 26 per cent in calendar 2023, the Magnificent 7 were responsible for 62 per cent of that gain. Exclude the Magnificent 7, however, and the S&P 500 grew just 9.8 per cent.
Take out the major seven mega-cap technology companies and adjust for the pandemic hit to earnings in the last decade, and valuations may not be anywhere near as stretched as the CAPE Shiller ratio would have you believe.
The S&P 500 is market cap weighted. Each company is ranked from one to 500 based on the total size of their market capitalisation and given a weighting to the index that is representative of their size versus the size of all 500 companies. Consequently, for every $100 you invest in the S&P500, seven dollars is invested in the largest company, Apple, and one cent is invested in the index’s smallest, Paramount Global.
If one equally weights the component companies of the S&P 500 however, the index’s 2023 gain its gain is not as impressive, up 24.2 per cent in 2024 versus 32.3 per cent for the standard index.
Thematic anchoring & buy USA
Earlier I alluded to the idea that what smart investors do at the beginning, dumb investors do at the end.
It’s an aphorism worth remembering.
Because information is proprietary and commercially valuable, its distribution is never even nor equitable. It leaks slowly, and consequently, justifications for taking on more risk that are valid at the beginning of a rally, are less valid after a year or two as the rally matures. Nevertheless, the uneven distribution of the thesis ensures there are those buying into it even a year or two after the first investors bet on it. Indeed, the late buying of the early thesis can fuel index gains that were unanticipated by those who initially postulated it.
Keep in mind that invalid theses can fuel market rallies because rising prices appear to validate them. Investors will pile on and even make a profit, though their thesis has no substance!
The latest theme gaining traction is faith in the U.S. economy outperforming all other economies.
I have previously noted that in the U.S., there are some extraordinary characteristics. First, the U.S. tech companies leading the markets are seriously extraordinary businesses reflecting some fundamental truths about the U.S. versus the rest of the world.
They include America being the largest economy in the world (and more resilient because exports account for only 12 per cent of gross domestic product, having the most desirable demographics of any developed nation, measurably the most productive labour force, the most arable land of any country, and being the world’s largest exporter of agricultural commodities and the largest producer and exporter of oil and gas. At 20 million barrels per day, the U.S. is the world’s biggest oil producer and exporter, with Saudi Arabia at number two with 12 million.
Having the deepest capital markets and some of the best tertiary institutions in the world has helped the U.S. become the world leader in research and development (reportedly spending US$879 billion last year – more than the next five countries combined), which, in turn, has put the U.S. at the forefront of technical innovation.
The businesses that have emerged are the world’s largest and have demonstrated the extraordinary ability to increase their returns on equity as they grow their equity base. That’s akin to a bank account earning higher and higher interest rates as its balance rises. Such businesses have broken the preconceived limits of the microeconomics taught at business schools for decades.
The only issue with the above thesis as a trigger for investing is that it has been true for a very long time. It was true when the S&P 500 was lower; it will be true when the S&P 500 is higher, and it will remain valid after the stock market, inevitably, crashes.
Bubbles can form when a good idea has gone too far.
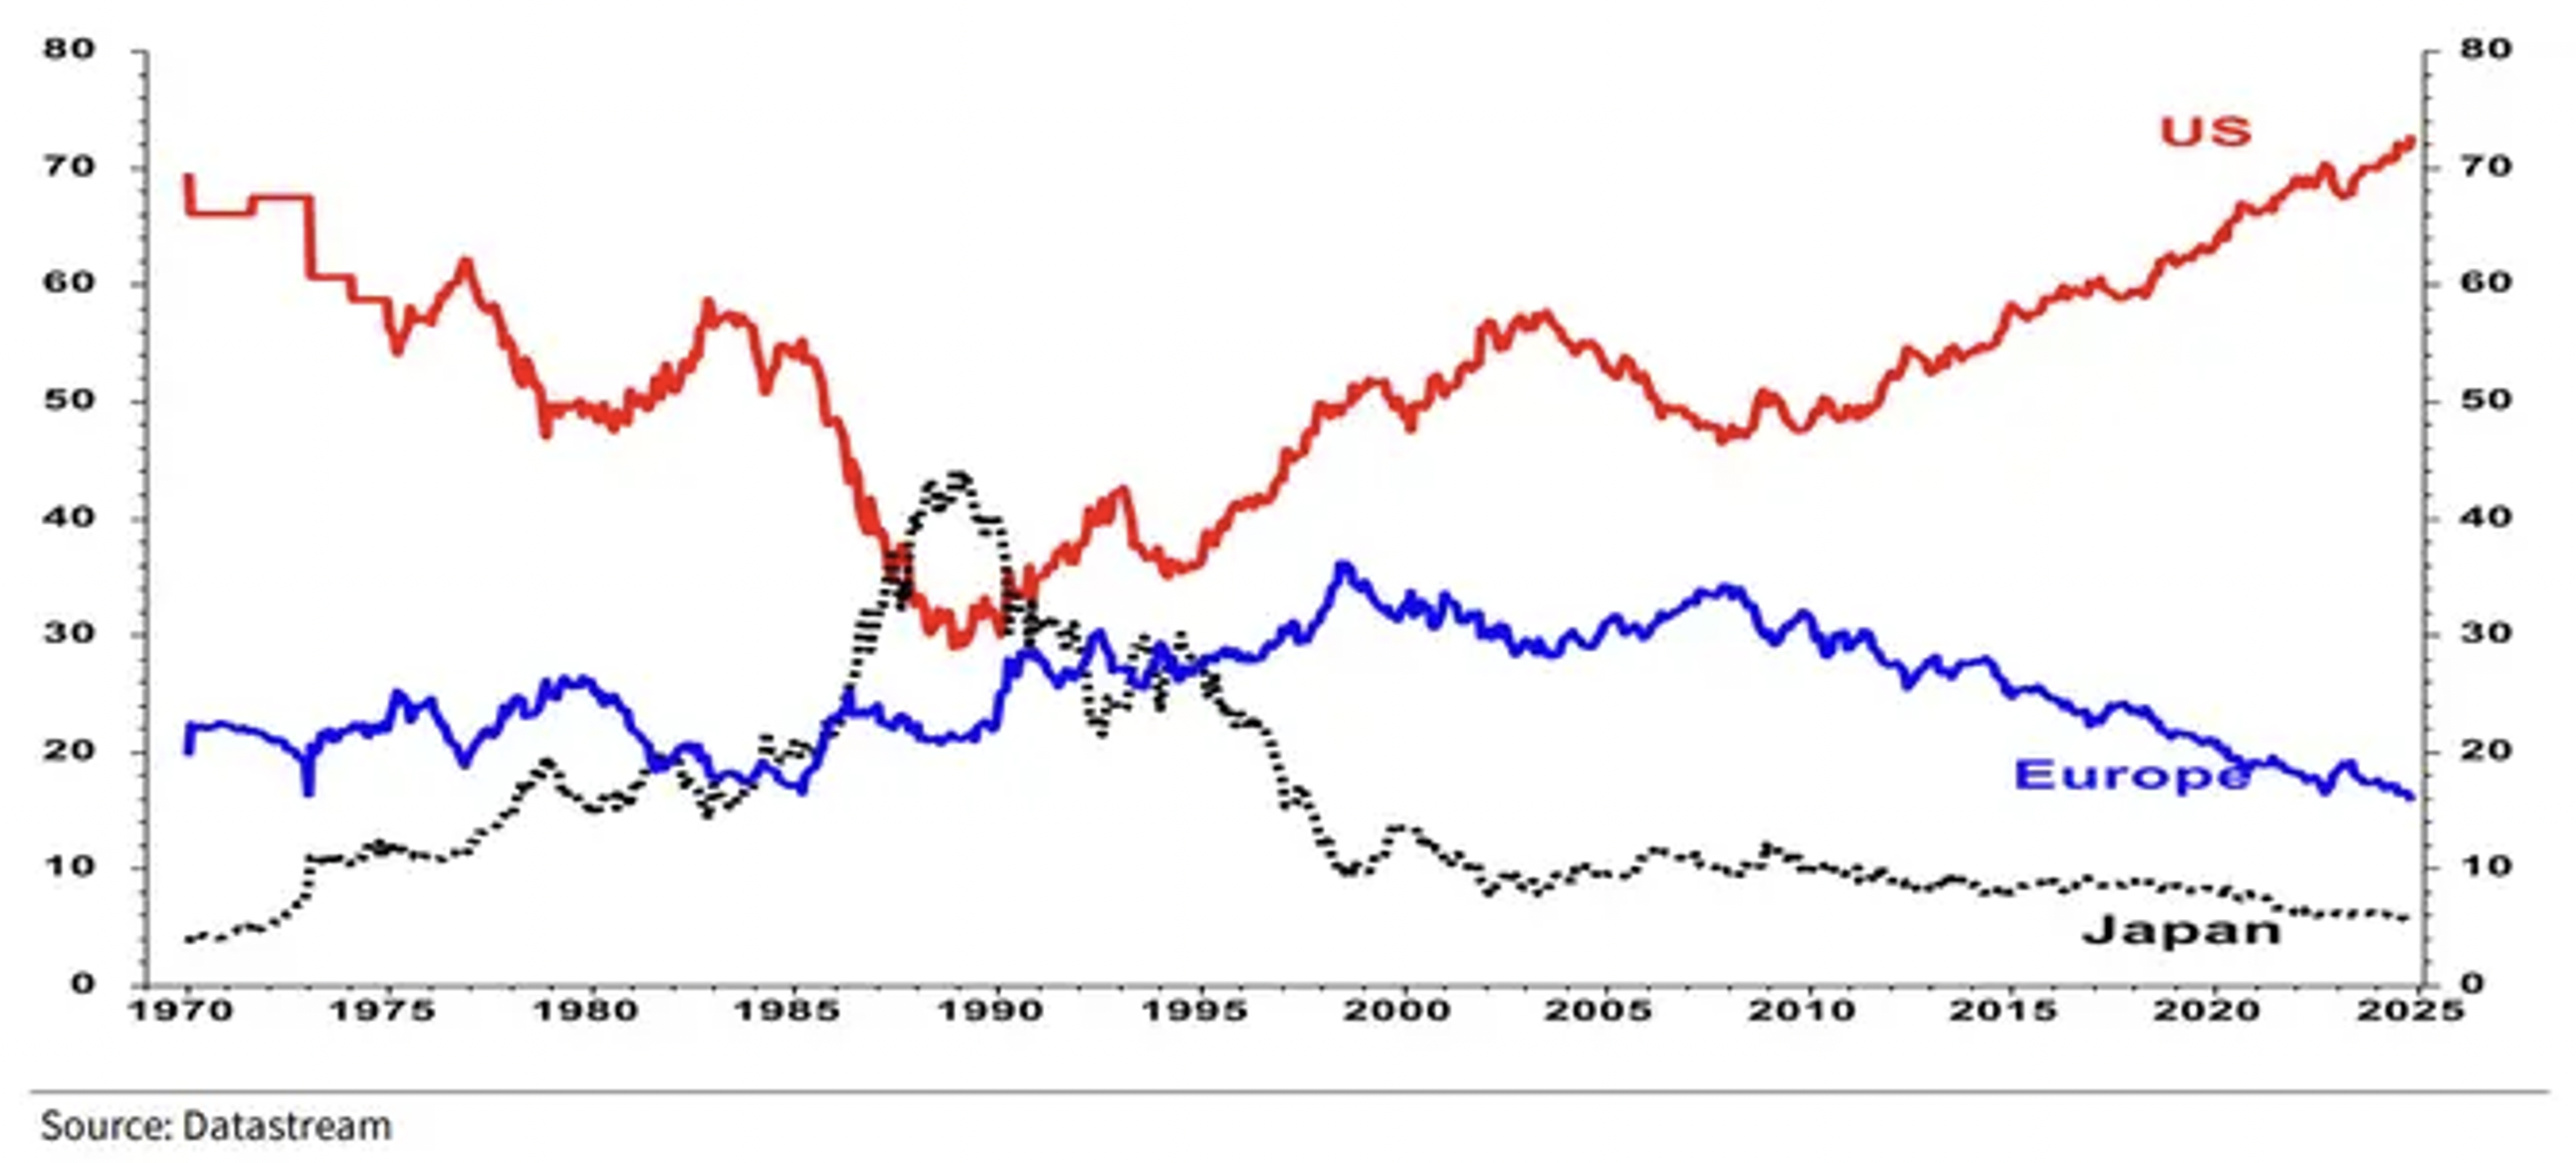
Despite this obvious reason to refrain from late investing in the thesis, global investors are committing more capital to a single country than ever.
Consequently, the U.S. market now accounts for three-quarters of the MSCI world index, up from 30 per cent in the 1980s.
Figure 4. U.S. now comprises circa 75% of MSCI world index
 Understandably, some commentators are suggesting “America is over-owned, overvalued and overhyped to a degree never seen before”.
A thought experiment
That a love affair exists for the U.S. and its stock market is no reason to bet against it. If however Trump succeeds in tying the U.S. to Bitcoin in a way that puts the financial system, and particularly bank balance sheets at the vanguard of the shift, we can construct a scenario that sees euphoria turn into a financial crisis. While the U.S. Securities and Exchange Commission’s approval of bitcoin exchange-traded funds earlier this year, more closely connected Bitcoin to the rest of the financial system, it has not done so in a systemically important way. That could all change, but today, that’s pure speculation and just one of a million possible scenarios that may never eventuate.
Liquidity
One thing that will eventuate is the refinancing of trillions of dollars of global debt taken out when interest rates were at zero. The global financial cliff will appear in 2026 and 2027.
While we may not be able to agree on whether we are in the early, mid or late stages of a boom, and while we won’t know if this is a bubble until after its demise, we can agree that the fuel needed to sustain it is liquidity. Perhaps the most important determinant of the boom’s longevity will be what demands are made of that liquidity which currently supports asset prices and speculation in them.
When an estimated US$70 trillion in debt is due to be refinanced in 2026 and 2027 at much higher interest rates, liquidity that had hitherto been fuel for an ‘everything boom’ will put the brakes on that boom.
Whether investors respond with panic or calmly take it in their stride remains to be seen.
For the current boom and speculative activity to continue however what is needed today is a supportive backdrop. And given the world is apparently immutably in love with the U.S., what Trump does next will paint some of that that backdrop.
Important will be that he doesn’t fuel the fans of inflation. Keeping in mind Tariffs are one of changes not inflation, Trump will need to ensure his pro-growth, pro-monopoly, anti-immigration and pro-tax cut policies don’t stoke inflation. Producing an extra couple of billion barrels of oil a day will help lower inflation, and if this can coincide with accelerating gross domestic product (GDP), equity markets should be content.
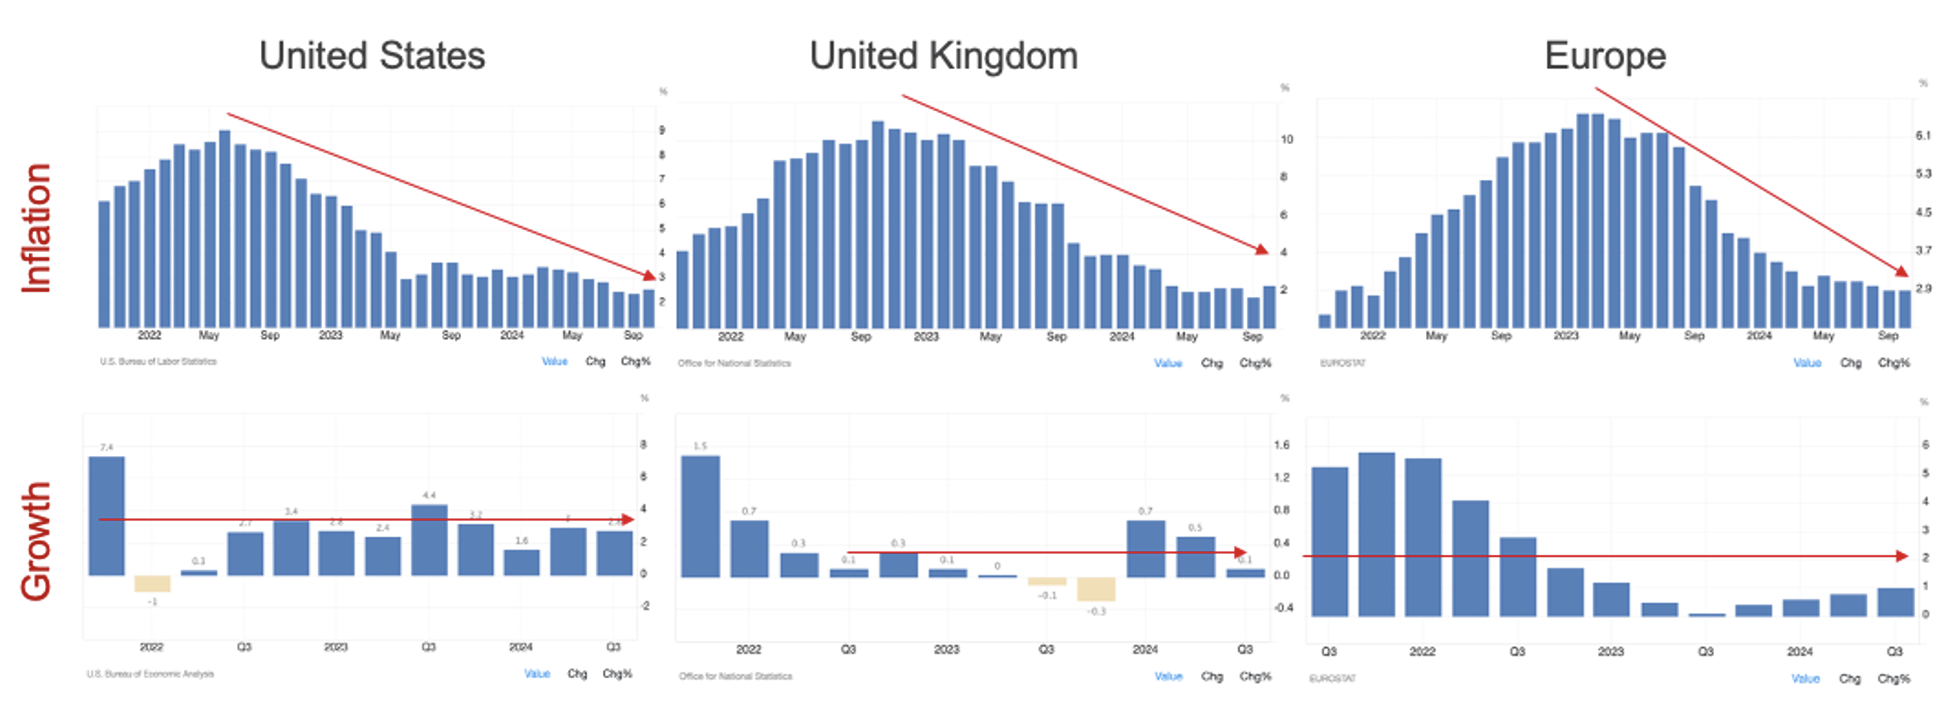
Since the 1970s a combination of disinflation and positive economic growth has always been supportive for the share prices of innovative companies with growth and pricing power.
Figure 5. GDP growth and disinflation.

As Figure 5., reveals disinflation and positive economic growth is precisely what exists.
Curiously, Trump’s tariffs may stoke faster economic growth in the U.S. if it supports businesses to front-run them by ordering inventory ahead of their imposition. They may also sponsor workers ahead of restrictions on immigration, fuelling stronger employment data.
So the backdrop is currently supportive for equities and supportive everything else. The boom should, therefore, continue. How long it lasts and whether it becomes a bubble remains to be seen. To borrow an oft-used metaphor, the band is still playing and the lights are still on, and as 2025 progresses towards Christmas investors might want to check whether the band is packing up.