
Boost your returns, Part II – It’s alive!
Boost your Returns Part 2 – It’s Alive!
In Part 1 of our Boost your Returns series, we introduced the idea of using pattern recognition technology to assist in the selection of potential investment candidates. You may recall we proposed using a machine learning model called a Support Vector Machine (SVM) to identify the features that separate good investment opportunities from poor ones. Having done that, we can aim the model at the A1-B3 universe in search of some hidden gems.
Since Part 1, we have gathered a large body of historical data and lovingly put it into a form that the SVM can interpret. Once the machine has learned all it can from that historical data, we can feed it current information on today’s S&P/ASX 200 companies, and ask it what it thinks of their prospects.
Before we let it off the leash, however, we want to do some testing to make sure the SVM has a good grip on things. We can do this by showing it part of the historical data (including investment returns) and then getting it to make forecasts for the investment returns of companies in the other part, based on what it has already learnt. If its predicted investment returns line up with the actuals, we will have some confidence that we are on track.
The data that we’ve gathered covers 10 years of ASX data from early 2004 up to late 2013. We fed the SVM the first 5 years of data (2004-2008), and asked it to forecast investment returns for our universe of companies in 2009. Once those forecasts were made, we showed the machine what the actual returns were in 2009, and then asked it to make forecasts for 2010. We kept repeating this process until we had 5 years of forecasts that we could compare with the actual returns.
There are a few ways we can check the veracity of these forecasts. One of the first things we did was look at how well the forecast returns correlated with the actual returns for companies in each GICS sector. The results are set out in Table 1, below.
Table 1: Correlation of forecast and actual returns
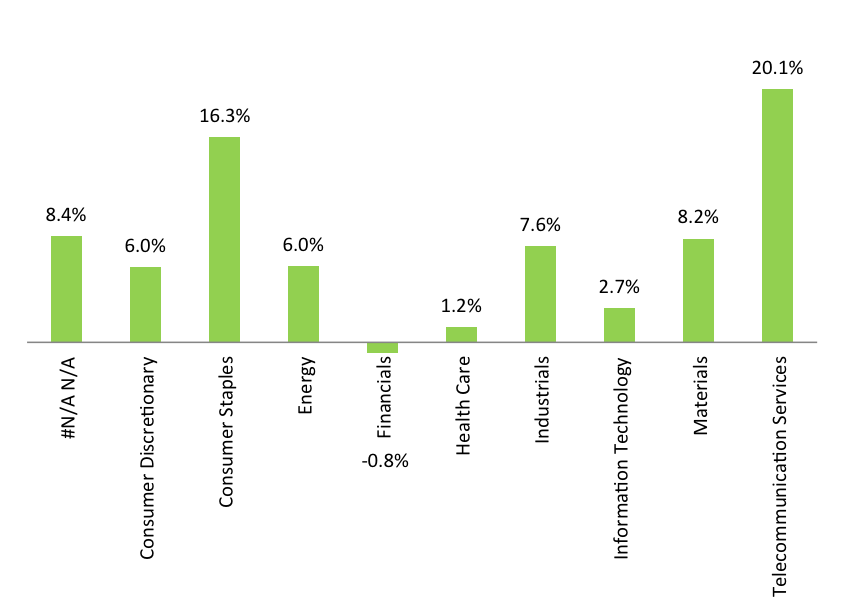
This analysis showed that the SVM forecasts correlated positively with actual returns for all sectors with the exception of financials. It is perhaps not surprising that financial companies proved tricky for the model, as the financial statements for these companies are very different to the financial statements for a more typical industrial business. We may be able to get better results in future by training a separate model that focuses just on financials. Note that #N/A N/A just indicates a company that has been delisted subsequent to the analysis.
Another feature of the results are the very high correlations achieved for consumer staples and telecommunications companies. However, this should be ignored – there are very few consumer staples and telco companies listed on the ASX, and so the results for these sectors suffer from small sample effects.
Overall, however, these results are pleasing, and give us comfort that the model works for a large part of the Australian market.
A second test is to look at the investment returns that were achieved by those companies that the SVM liked, and those that it didn’t. For this test we looked at the returns earned on a portfolio comprising the top 20 per cent of stocks as chosen by the model, rebalanced every 3 months, and a portfolio comprising the bottom 20 per cent. The results were interesting.
On average, companies in the top 20 per cent portfolio produced a return that was more than 5 per cent higher (per annum) than the average of all other companies. This is a result that most fund managers would be delighted with, although it should be noted that this figure does not include any transaction costs. Also, back-test results tend to look better than results achieved in the real world, so some caution is appropriate.
What was even more interesting were the companies the model disliked. Companies in the bottom 20 per cent portfolio provided a return that was around 13 per cent p.a. below the average of all other companies. A remarkably large gap; and one that suggests the model became quite effective at identifying poor investment candidates.
As with any back-test, this needs to be taken with a grain of salt. However, the analysis suggests to us that the pattern recognition methodology applied in the SVM has some real value in assessing investment candidates.
To finish this instalment, we’ll summarise some of the features that put companies into either the top or bottom 20 per cent portfolios. When we trained the model, we gave it a large amount of financial and market data on each company, and at the end of the process we could identify which bits of data the model had found useful, and which bits it threw on the scrap heap. Some relevant observations include:
- Performance counts. The SVM found it useful to look at a range of earnings and cashflow metrics for each company. We were pleased to see this, as these types of measures are the foundation of our own performance and quality scoring system. One particular lesson that emerged is that it’s important to pay attention to cashflows as well as reported earnings.
- Value matters. We gave the model information on P:E ratios, EV:EBITDA multiples, Price:Book ratios, as well as estimated valuations produced by our proprietary valuation software. The SVM paid us the compliment of retaining the valuation measure produced by our internal software, and discarding all the others.
- Momentum works. While it’s a simple measure, momentum can tell you something about a company’s prospects. The SVM used several share price metrics in arriving at a view on future investment performance, including some proprietary measures that we employ in managing The Montgomery Fund. It seems there is some truth in the old adage that “the trend is your friend”.
- Volatility is not your friend. The SVM showed a clear bias against companies with a volatile share price. Volatile companies may be exciting in the way that a visit to the casino is exciting, but if you want real investment performance then it may be best to find calmer waters.
- Acquisitions are a warning sign. While it wasn’t a big factor, the SVM preferred companies that grow organically over those that grow by acquisition. We suspect that on average, acquisitions probably don’t add value for shareholders, although some highly synergistic acquisitions clearly do.
We’ll finish there for Part 2. Having gained some confidence that the SVM is making sensible forecasts based on sound analysis, we can move on and look at which companies in today’s ASX 200 find their way into the top and bottom portfolios. In Part 3, we’ll start to look at these companies, and think about whether we agree with the choices made by the machine.
Tim joined Montgomery in July 2012 and is a senior member of the investment team. Prior to this, Tim was an Executive Director in the corporate advisory division of Gresham Partners, where he worked for 17 years. Tim focuses on quant investing and market-neutral strategies.
This post was contributed by a representative of Montgomery Investment Management Pty Limited (AFSL No. 354564). The principal purpose of this post is to provide factual information and not provide financial product advice. Additionally, the information provided is not intended to provide any recommendation or opinion about any financial product. Any commentary and statements of opinion however may contain general advice only that is prepared without taking into account your personal objectives, financial circumstances or needs. Because of this, before acting on any of the information provided, you should always consider its appropriateness in light of your personal objectives, financial circumstances and needs and should consider seeking independent advice from a financial advisor if necessary before making any decisions. This post specifically excludes personal advice.
Hello Tim,
Is the zero investment strategy (top 20% minus bottom 20%) returns risk adjusted?
Hi Gareth,
We haven’t looked at risk or liquidity yet. Might make some observations on this in a future article.
Hi Tim,
A great second part to the article.
A quick question around the statistical results. While the results from the backtesting were certainly impressive, it does appear that the correlation scores (assuming Pearsons correlation coefficient?) are extremely low.
While obviously the direction of the correlation is important, what is even more important is the magnitude of the number. While interpretation of correlation coefficients is obviously subjective, anything below the 30-40% range would imply a very weak relationship between actual and predicted returns. Anything below 10% would essentially means there’s no relationship…
Joe
Joe,
That’s a good observation, and one I should have mentioned in my post. The correlation scores are indeed low in absolute terms, and the relationship between predicted and actual returns is correspondingly “weak”. However, this is very much the nature of stock-picking methodologies, be they quantitative or otherwise. There is a large element of random noise inherent in future returns, and even the very best stock-pickers will typically get less than 60% of their investment calls right. The good news is that a small edge, combined with a diversified portfolio and a bit of compounding over time, is enough to yield very good investment results – hence the portfolio returns look impressive. Our analysis indicates strong statistical significance, and one way to reconcile this is to ask how likely it is that you would see 9 out of 10 positive correlations (by GICS sector) if there were no relationship.
Thanks for the update Tim, i am finding this series of posts very interesting. I have been thinking quite a bit myself about coming up with a quantatitive system which may help identify the quality and performance of stocks in the future using historical data.
I assume you are also going to look at how the SVM performs with companies based on time listed on the ASX? I would expect that longer listed companies would fare better than newer ones who might only have 1-5 years of results.
Looking forward to part 3 and any future updates on this process.
keep up the good work guys.