
Australia’s demand for data is off the charts!
As we have previously noted, the demand for data in Australia (and the world) is growing at an exponential rate and the statistics are staggering. IBM notes here that “Every day, we create 2.5 quintillion bytes of data — so much that 90% of the data in the world today has been created in the last two years alone.”
As we reviewed the space a few charts caught our eye today, which we’ve pasted below. All these charts are available from IX Australia (see here), which records data demand at different times of the day for a group of providers. Below is an overview of New South Wales data demand from this Monday to Tuesday. Notably the peak of data demand is after business hours at about 8pm.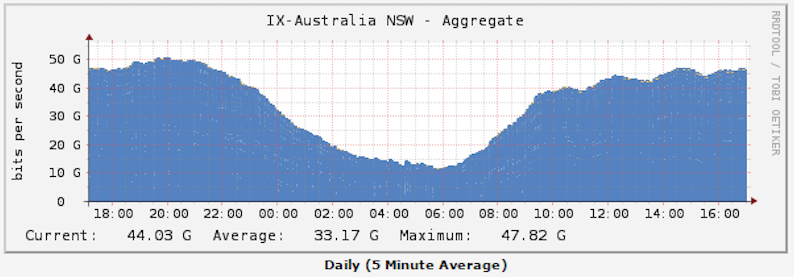 But what we really find interesting is the below. It appears that in the last 6 months, demand for data has increased at least twice (at least in this sample). We at Montgomery have been aware of the rapid growth of data demand, but this is off the charts! (pun intended)
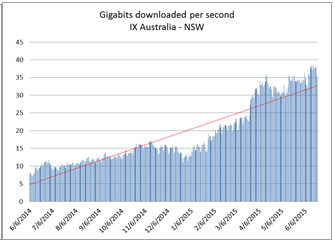
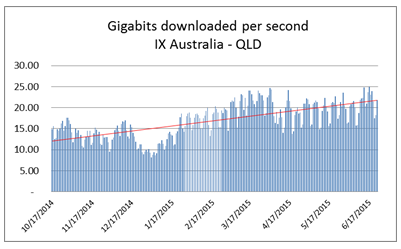
We noticed less pronounced increases in other states – although substantial increases nonetheless.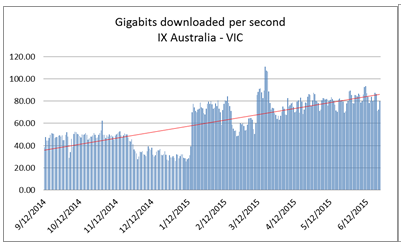
 We’re currently investigating what’s behind the sudden change. Naturally the first thought that springs to mind is that data demand is being driven by video streaming from services such as Netflix or Stan (from a timing standpoint the change seems to fit in better with Stan than Netflix).
Video streaming can easily gobble up 1-3 Gigabytes of data per hour on a per user basis. However, most internet users have been streaming video from various sources on the web for several years now. So this may or nor may not be the answer.
Overall, higher data demand should drive revenues for internet service providers such as TPG Telecom (ASX: TPM), M2 Group Limited (ASX: MTU) & Telstra Corporation Limited (AXS: TLS) as customers upgrade plans in favour of higher download limits (and when the NBN comes out, improved speed). Higher data usage does mean more costs for the Internet Service Provider’s, but on current information we believe that this can be offset by the higher cost of plans or even price rises.
It’s an interesting puzzle that we’ll continue to look into. As for the telecommunications space, we’re currently cautious bulls – happy to commit more capital at the right price.
The Montgomery Fund and the Montgomery [Private] Fund own shares in M2 Group Limited.
Scott Shuttleworth is an analyst at Montgomery Investment Management. To invest with Montgomery, find out more.
This post was contributed by a representative of Montgomery Investment Management Pty Limited (AFSL No. 354564). The principal purpose of this post is to provide factual information and not provide financial product advice. Additionally, the information provided is not intended to provide any recommendation or opinion about any financial product. Any commentary and statements of opinion however may contain general advice only that is prepared without taking into account your personal objectives, financial circumstances or needs. Because of this, before acting on any of the information provided, you should always consider its appropriateness in light of your personal objectives, financial circumstances and needs and should consider seeking independent advice from a financial advisor if necessary before making any decisions. This post specifically excludes personal advice.
INVEST WITH MONTGOMERY
We have Telstra Home/Internet plan & were happy on 5Gb data, free local calls & National calls capped at $1. Low & behold we received an extra 45Gb to our plan at no extra cost but also an offer of 3 months free access to STAN which would later cost us an extra $10 per month to continue using. We are not interested in STAN or any other similar product. We would actually have preferred a lower cost to stay at 5Gb or 10 at most. I assume though that lots of people took them up on the offer & are now hooked on STAN or moved to Netflix but the assumption that the plan costs have increased just for access to extra data is not real. Telstra could be allowing us the extra data & we use another platform for our movie downloads I guess?
Anyway it’s interesting for sure. Telstra also offered us security cover for $9.95 per month but I think they should be offering that security in the monthly contract already. Imagine if the banks added extra fees for security to use their ATMs & online banking. Just a few thoughts.
Just a personal anecdote: My family recently upgraded from ADSL2+ to Telstra cable. On ADSL, we were running at approx 40GB per month, but since the upgrade, we are tracking at 100GB per month.
I think this is due to the improved quality of service from the increased bandwidth. We no longer have to wait minutes to stream video, and we can stream concurrently on multiple devices, download a movie from FetchTV instantaneously and so on. This improved bandwidth has fast changed our habits and increased data consumption, even though we had broadband in both instances.
Thoughts on small cap telco – Big Air Group (BGL).
Would these guys reap some of the benefits of increased data consumption?
Regards,
Dan
Hi Dan, thanks for your question. We’re not currently holding BGL and aren’t following it closely enough to give you a good answer. Apologies!
Hi Scott,
NSW-IX is much less mature, having only been setup in the last couple years, thus peers have been (and still are) coming on board. Taking that into account NSW would see similar growth to other states.
None of the primary carriers will peer on IX (as providing free transit goes against their business model), so the bulk of domestic data isn’t captured, but is useful for showing trends.
Peak is usually around 1800-2100 for ISP. Some ISP block P2P using DPI and only release this during the wee hours, you should see the traffic spike up once those gates are opened!
It is also interesting to see protocol breakdown, as file sharing and streaming services such as Netflix take up a huge bulk of the data. Most of this is taken from CDN domestically (such as Limelight, Akamai, Edgecast, etc).
Working closely with this sector I can probably go on and bore people to tears but will stop here. =)
Cheers,
Jules
Hi Jules, thanks for the above, very insightful.
Please feel free to elaborate, we’re always interested in new information.
My theory for the influx is not just the QUANTITY of media being consumed (eg: videos), but the QUALITY too. Years ago it was Xvid, then 720p, then 1080p, and now 4K. And the increase in the amount of data between each step is not simply double, but many multiples.
576i (Australian Free to Air) = 414720 pixels
720p = 921600 pixels (120% increase)
1080p = 2073600 pixels (125% increase)
4K = 8294400 pixels (300% increase)
8K = 33177600 pixels (300% increase)
In saying that, better compression codecs like x265 are greatly helping in reducing file sizes. For example, I’ve just compared an x264 vs x265 file of a popular TV show, both at 720p and similar quality. x264 = 1710MB vs 414MB using x265 (313% reduction). Though, compatibility of software/players with the new codecs will impede uptake/result in a slow conversion by the masses.
And that’s only looking at the personal consumer market. Businesses are a whole other arena (movement to cloud technologies, BYOD, mobility, always-on access). Huge changes happening here. Where I work we are in the process of “web-ifying” everything.
Great points Ash, thanks