
Australian property update
I recently wrote here about the economics of borrowing 100 per cent of the purchase price for a two-bedroom apartment, and the results weren’t compelling. Despite the annual losses incurred from carrying the property and the historical lack of sufficient capital gains to offset those losses enough to render the investment superior to an equivalent investment in private credit, most Australians will trip over themselves to own an investment property. Bragging rights at dinner parties and keeping up with the Joneses may have something to do with it. As they say, you can lead a horse to water…
Given that property’s popularity remains undiminished, it’s worth reflecting on the latest data revealed by CoreLogic in their monthly housing chart pack.
The annual growth rate of Australian dwelling values continued to ease from 9.4 per cent over the year to February to 8.3 per cent over the 12 months to May. And over the three months to May, lower quartile dwelling values rose at more than twice the pace of upper quartile values (3.0 per cent versus 1.2 per cent), with growth conditions continuing to be skewed toward the more affordable section of the market.
For Sydney-siders, dwelling values rose by 0.6 per cent for the month of May, 1.2 per cent over the three months to May and 7.4 per cent for the twelve months to May. Sydney values now equal their January 2022 highs.
In Melbourne, the numbers were 0.1 per cent, -0.2 per cent and 1.8 per cent, respectively, demonstrating a serious impact from the introduction of draconian anti-investor tax changes by that state’s socialist government. Dwelling values are now four per cent below their March 2022 highs.
Brisbane dwelling values have hit a new record, thanks in part to migrating Victorians. Dwelling values rose by 1.4 per cent for the month of May, 3.9 per cent over the three months to May and a massive 16.9 per cent for the twelve months to May.
Adelaide prices are also at a new record, with dwelling values rising by 1.8 per cent for the month of May, 4.3 per cent over the three months to May and an extraordinary 14.4 per cent for the twelve months to May.
Over in Perth, dwelling values rose by 2.0 per cent for the month of May, 6.1 per cent over the three months to May and a massive 22 per cent for the twelve months to May.
Hobart, Darwin and Canberra saw lower annual increases to May of -0.1 per cent, 3.5 per cent and 2 per cent, respectively.
According to CoreLogic, in the four weeks to June 2nd, new listings totalled 38,236 nationally. New listings are trending higher than the historic five-year average and higher than this time last year, driven by above-average vendor activity in Sydney and Melbourne in particular. Those 38,236 listings were 17.2 per cent higher than the same time last year but lower than in 2022. They were also up 7.3 per cent compared to the average of the last five years.
At the national level, the total stock for sale was 138,519 over the four weeks to June 2nd. Despite new listings tracking above average, overall listing levels have remained fairly subdued due to strong sales taking stock off the market. Total stock for sale at this time of year is 1.6 per cent below the same time last year and 18.1 per cent lower than the five-year average total stock for sale at this time of year.
Again, reflecting the new Victorian labour taxes, the state stands out as having significantly higher total listings than this time last year. At the other end of the spectrum, Perth listings volumes were further depleted -23.8 per cent in the same period. The diversity in stock levels across the cities partly explains the different capital growth trends noted earlier.
The national median time on the market was 31 days in the three months to May, which was steady compared to this time last year. Beneath the relatively stable national figures, days on market across Perth dropped to just 10 days (from 15 days this time last year), while homes are taking longer to sell in Sydney, Melbourne and Hobart.
Vendor discounting rates dropped slightly across the combined capital cities market over the three months to May. The median vendor discount was -3.3 per cent over the period, down from -3.2 per cent in the previous month. Despite varied market conditions across the capital cities, vendor discounting was smaller compared to this time last year in most markets.
The combined capital cities clearance rate has gradually trended lower since early February, suggesting slightly weaker selling conditions amid high interest rates and a weakening economic environment. In the four weeks ending June 2nd, the combined capital cities clearance rate averaged 65.1 per cent, down from 65.9 per cent in the previous four-week period.
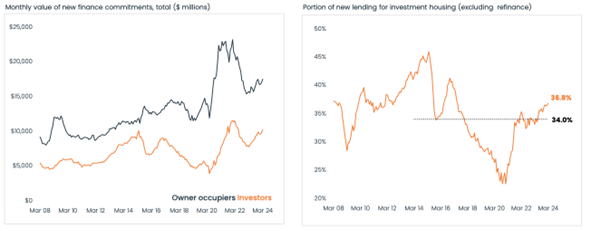
Figure 1. New finance commitments and lending for investment housing
 Source: CoreLogic, ABS
Intentions, however, might be changing. The value of home lending rose 4.8 per cent through April (Figure 1.), to $29.4 billion. Owner-occupier finance accounted for most of the monthly increase (around 57 per cent). However, the pace of increase was faster across investment property lending, which was up 5.6 per cent month-on-month, compared to a 4.3 per cent lift across owner-occupier lending. However, mortgage originations for ‘riskier’ types of lending remains near historic lows.
Roger Montgomery is the Founder and Chairman of Montgomery Investment Management. Roger has over three decades of experience in funds management and related activities, including equities analysis, equity and derivatives strategy, trading and stockbroking. Prior to establishing Montgomery, Roger held positions at Ord Minnett Jardine Fleming, BT (Australia) Limited and Merrill Lynch.
He is also author of best-selling investment guide-book for the stock market, Value.able – how to value the best stocks and buy them for less than they are worth.
Roger appears regularly on television and radio, and in the press, including ABC radio and TV, The Australian and Ausbiz. View upcoming media appearances.
This post was contributed by a representative of Montgomery Investment Management Pty Limited (AFSL No. 354564). The principal purpose of this post is to provide factual information and not provide financial product advice. Additionally, the information provided is not intended to provide any recommendation or opinion about any financial product. Any commentary and statements of opinion however may contain general advice only that is prepared without taking into account your personal objectives, financial circumstances or needs. Because of this, before acting on any of the information provided, you should always consider its appropriateness in light of your personal objectives, financial circumstances and needs and should consider seeking independent advice from a financial advisor if necessary before making any decisions. This post specifically excludes personal advice.
Agreed Roger. Think of this; you say “I’ve got an investment property” and everyone goes “oooh” and thinks you’re rich. I’ve even heard terms like “slum lord” or “infestor” thrown around, as though we are taking advantage of people who rent; nothing could be further from the truth for those of us who are responsible landlords.
Even owning a commercial property doesn’t attract the same level of negative comments.
But if you say “I’ve got a share portfolio that owns and invests in several businesses” and no one thinks that’s particularly special.
You might get people saying “oh, do you ‘play the markets’ ?” but that is the complete opposite of what we really should be doing; finding, buying and holding great companies.
I don’t know why, but there’s also a little bit of jealousy attached to the former, as though, as soon as you have the cachet of an ‘investment property’ it’s “you’re doing better than me” but if I said that I had a share portfolio of equal value (and with a comparable loan against that), people think I’m a gambler or “lucky” that I made money that way.
Also, no one will ever ask me for a “hot tip” on which suburb is going to do well over the next “however long” or what a house should be worth there.
Interesting insights Chris, I was not aware so many people detest property owners. Growing up in the 70’s 80’s and 90’s it seemed a valid aspiration rather than something to be derided. Thanks for sharing.