Analyst Forecasts
In evaluating the future prospects for a business, one useful source of information is analyst earnings estimates. A good broking analyst who covers a particular company will often have a well-informed view of the factors that might influence earnings for that company in the years ahead.
At the same time, there are a number of biases and other issues with analysts’ forecasts. One interesting issue is that the forecasts can have a certain “inertia” to them, which means that changes may occur gradually over time. Because of this, it can be useful to look at the history of the forecasts, as well as the current level.
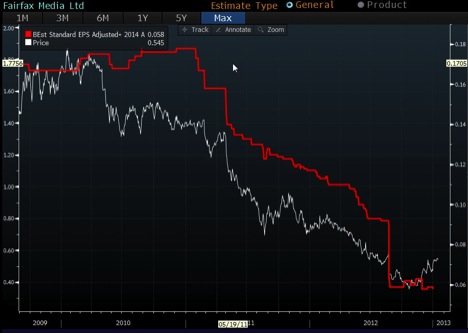
The chart below shows how the analyst consensus FY2014 earnings forecast for Fairfax has changed over time. It indicates that, in 2010 analysts were projecting 2014 EPS for Fairfax of around $0.18/share. Over the course of 2011 and 2012, these expectations have been wound back to around $0.06/share.
An investor who studied this chart during 2011 may have noticed a clear pattern of declines emerging, and asked themselves whether this may be ongoing. If they considered this in the context of advertising migrating from print to online, they may well have concluded that there could be more to come.
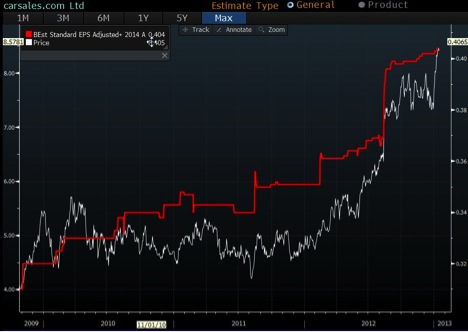
The chart below shows the same data for Carsasles.com, one of the beneficiaries of the migration of advertising from print to online. Again, an investor who studied the chart in 2011 may have noticed a pattern, and considered whether there may be more to come.
There are several reasons why analyst’s forecasts may behave this way. One is that upgrades and downgrades to company guidance tend to come in stages: if a company downgrades its guidance, history suggests an increased likelihood of one or more further downgrades to follow. A similar pattern exits for upgrades.
Another factor is the analysts’ desire not to be too far away from consensus. There is a material risk to an analyst’s career if they have a very different view to everyone else and get it wrong.
In any event, professional investors sometimes find it useful to look at changes to analyst forecasts as well as the forecasts themselves. A historical pattern of increases or declines may not extend into the future, but if the pattern exists it’s worth thinking about what the underlying drivers are, and whether they still have some way to run.


This comment is not directly related to analyst forecasts, however, those interested in Codan will be interested in this story, about the 5.5kg gold nugget found in Ballarat with a minelab metal detector.
http://www.heraldsun.com.au/news/victoria/prospector-strikes-55kg-gold-nugget-in-ballarat-victoria/story-e6frf7kx-1226555879738
just want to thank you roger
i have spent years buying courses attending lectures studying technical analysis
buying shares etc with very little return.
by focusing on your value investing method & with access to your videos etc the returns will come.
once again thank you for showing the way
Absolutely delighted Trevor! Thank you for the excellent feedback.
Thanks Roger. It all helps to paint an overall picture of the company.