
All parties must end
Markets sit at elevated levels, fuelled by optimism around artificial intelligence and the promise of lasting productivity gains. Yet beneath the excitement lies a complex mix of valuations, momentum, and risk – raising important questions about how investors can stay positioned if sentiment shifts.
Markets are expensive – observations and implications
There is a conga line of analysts, fund managers and commentators pointing out the extremes many traditional or conventional measures of value have now reached. From price-to-earnings, price-to-book, and market-cap-to-Gross Domestic Product (GDP) to earnings and dividend yields, the U.S. S&P 500 is in rarified air when it comes to the price investors are willing to pay for exposure to future growth.
Figure 1., shows what the President, of U.S.-based Hussman Investment Trust,
John P. Hussman, describes as the “most reliable gauge of market valuations in data since 1928.” Figure 1 is a plot of the ratio of nonfinancial market capitalisation to gross value-added (GVA), where GVA is the sum of corporate revenues generated incrementally at each stage of production. In other words, Hussman’s chart plots price-to-revenue for U.S. nonfinancial corporations.
Figure 1. Market cap to GVA
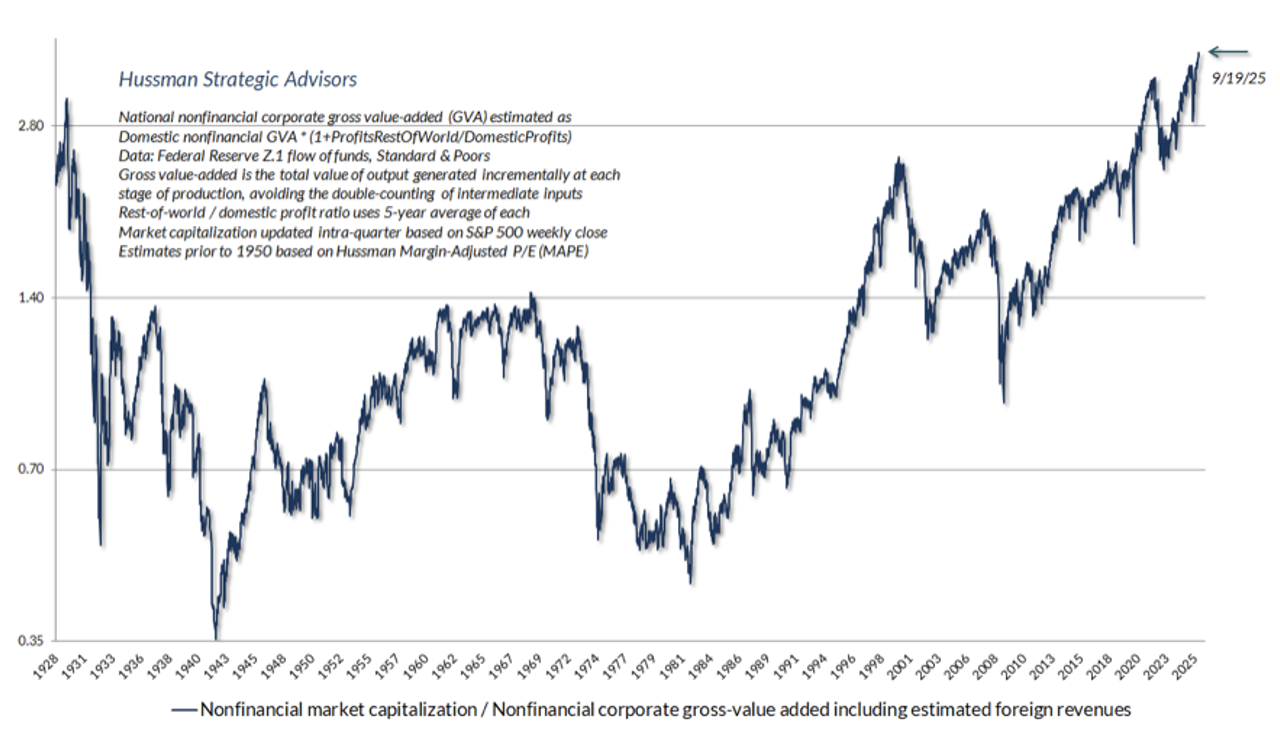
Source: Hussman Funds
As is clear on this measure, current valuations are the highest in U.S. history, easily exceeding both the 1929 and 2000 extremes.
I have noted many times here at the blog, over the last 15 years, that high multiples don’t, by themselves, portend an imminent correction. As history also reveals, high multiples can expand further. Indeed, that’s what records are – new all-time highs.
What high multiples do portend however is low future returns. As Warren Buffett has been fond of pointing out to the uninitiated, the higher the price you pay, the lower your return.
As Figure 2., demonstrates, Hussman has done some work to show there are solid relationships between price multiples and future returns.
Figure 2. non-financial market cap-to-GVA, subsequent 12 year nominal annual returns
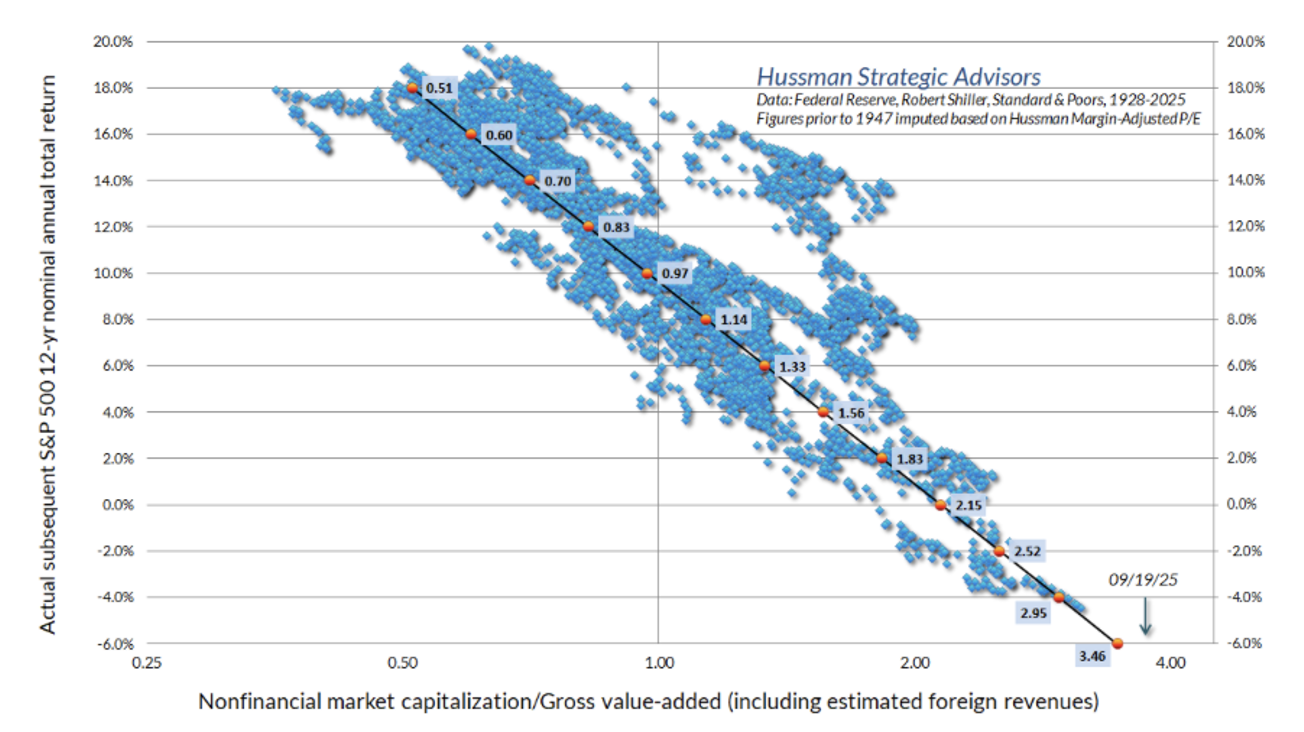
Source: Hussman Funds
Figure 2., shows Hussman’s valuation measure on a log scale, versus the actual subsequent nominal total returns for the S&P 500 over the following 12-year period, since 1928.
Figure 2., reveals there is a clear inverse relationship between the price paid and the subsequent return. The higher the multiple at the time of acquisition, the lower the return of the next dozen years. Understandably, there have to be limits. Returns cannot, for example, continue indefinitely at double-digit rates because the earth today provides a limit. There’s a finite boundary. If Nvidia continued to grow at double-digit rates for long enough, it would become earth, and that’s impossible.
And what does Figure 2., conclude? The implied annual average compounded return, including dividends, over the next twelve years to 2037, from investing in today’s S&P 500, is minus – six per cent.
And it isn’t just Hussman predicting mediocre returns from investing in the leading U.S. stocks today. Vanguard are suggesting “investors focus not on the short-term theatrics of potential rate cuts, but on the longer-term forces shaping returns.”
Figure 3. Vanguard’s outlook for financial markets
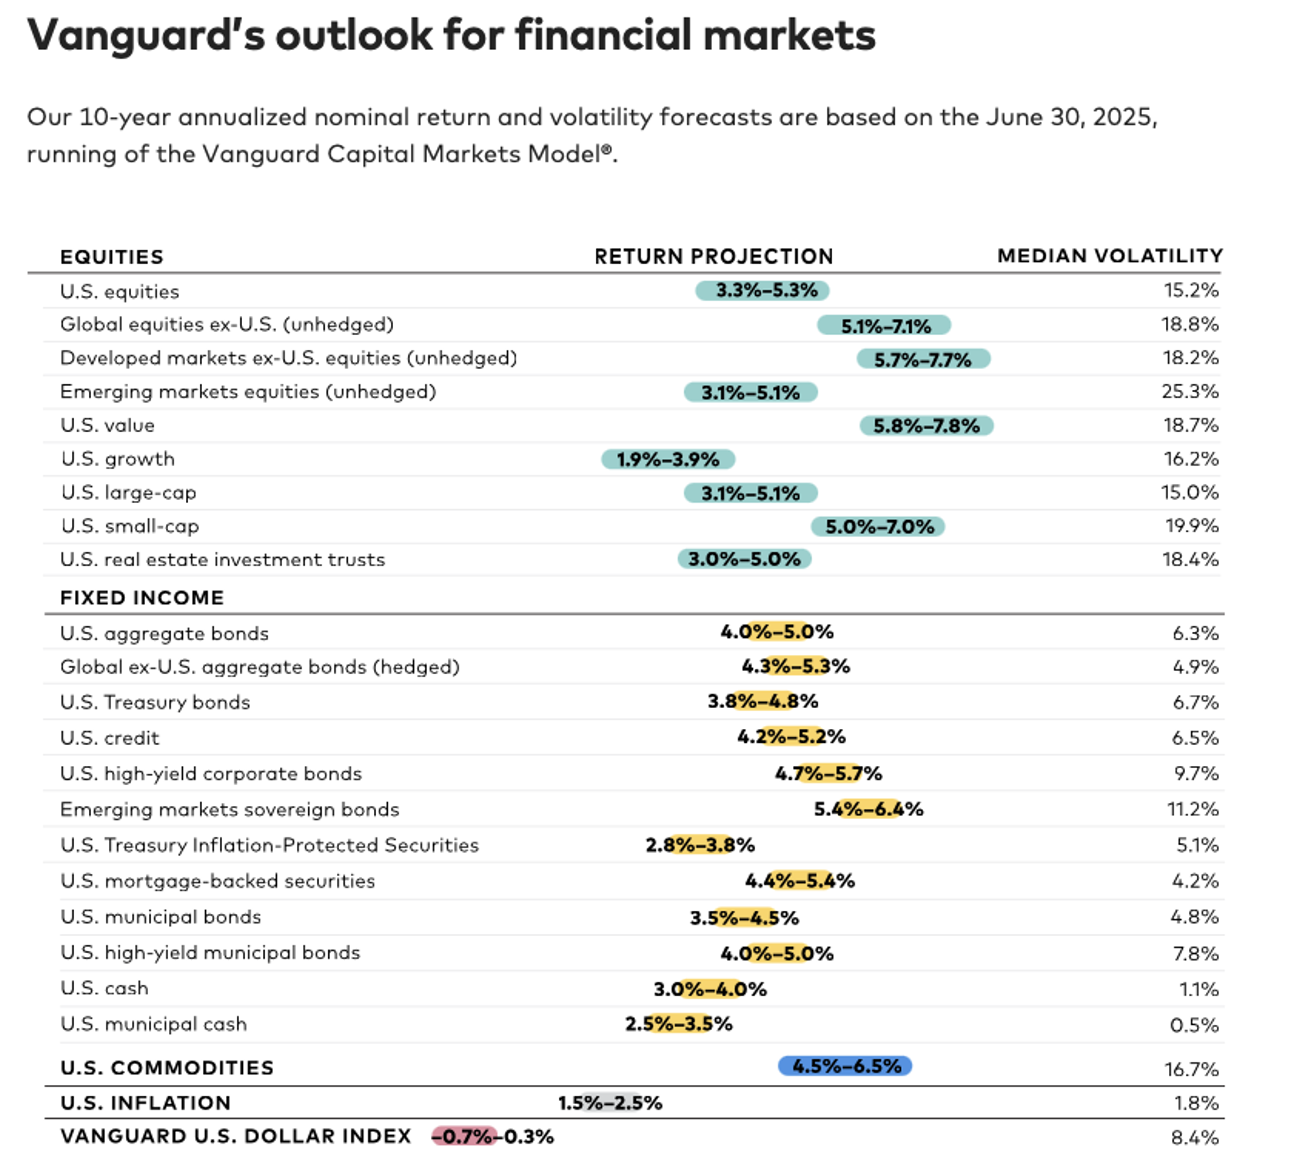
Source: Vanguard
Figure 3 reveals Vanguard’s 10-year annualised nominal return and volatility forecasts, which are based on the June 30, 2025, running of their Vanguard Capital Markets Model. It shows equities are expected to return 3.3 to 5.3 per cent per annum over the next decade, while growth stocks (count the big technology names in that lot) are expected to deliver between 1.9 and 3.9 per cent per annum.
Given those low expected returns are also expected be accompanied by volatility of more than 16 per cent, one starts to wonder whether it’s possible to obtain a better rate of return with significantly less volatility. Vanguard suggests that even fixed income looks appealing (U.S. Treasury Bond returns of 3.8 – 4.8 per cent) when yields are at historically attractive levels, especially relative to historically low equity dividend yields. Of course that conclusion probably ignores the rise in the gold price, which has occurred on the bank of global central bank demand that has seen holdings of gold surpass holdings of U.S. Treasuries, possibly indicating a change in global appetite for U.S. I owe yous (IOUs).
In any case, there may be superior alternatives. More on that momentarily.
Why are markets expensive
There’s a lot for equity investors to digest right now. From deteriorating geopolitics, the undermining of the U.S. Federal Reserve’s (the Fed) independence, persistently high inflation (Figure 4), to the threat of stagflation, the stock market bears can point to a litany of reasons the stock market at current levels is unpalatable. But all of the above concerns are known, and the market hasn’t reacted, suggesting that it probably won’t. At least not on the back of these factors.
Figure 4. Inflation has remained above the Fed’s Target for five years
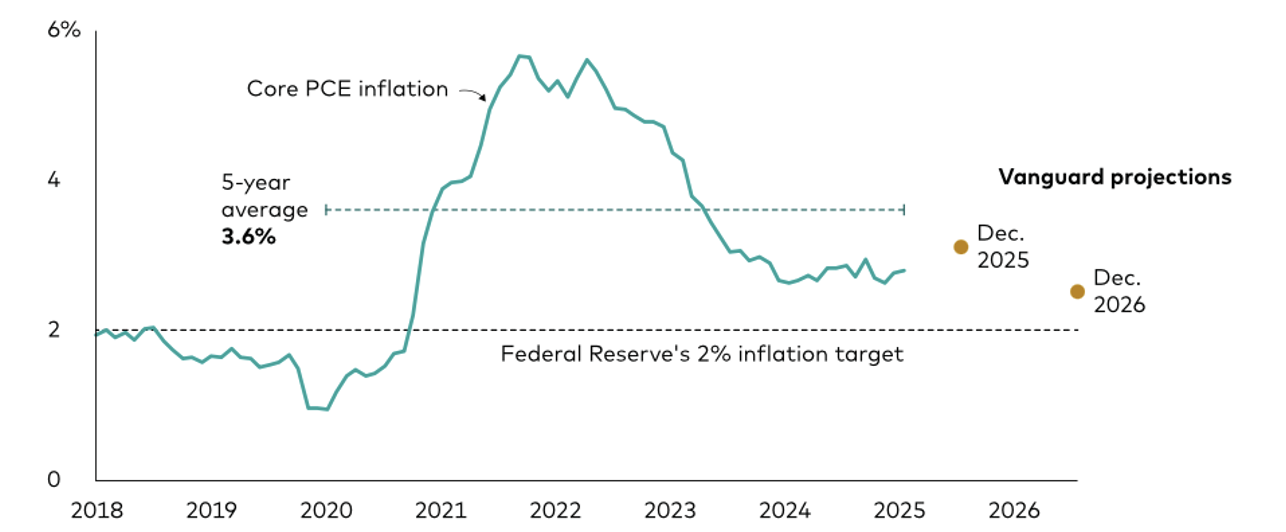
Source: Vanguard, U.S. Bureau of Economic Analysis
What is buoying the market is the excitement around Artificial Intelligence (AI).
Following its persistent rise over the past few weeks, the S&P 500 is now reflecting a lot of anticipated good news, trading at the highest forward valuations historically. Of course, those record levels are also due to the growing influence of a handful of technology companies upon whom hopes of uninterrupted growth and profits have been placed.
The AI theme however needs cash to fuel it. A reportable thematic can only exist when there’s money available to bet on it. That money can be measured through another index that has been rising without breath: the Global Liquidity Index.
Figure 5. Global central bank liquidity & MSCI, 2011 – 2025
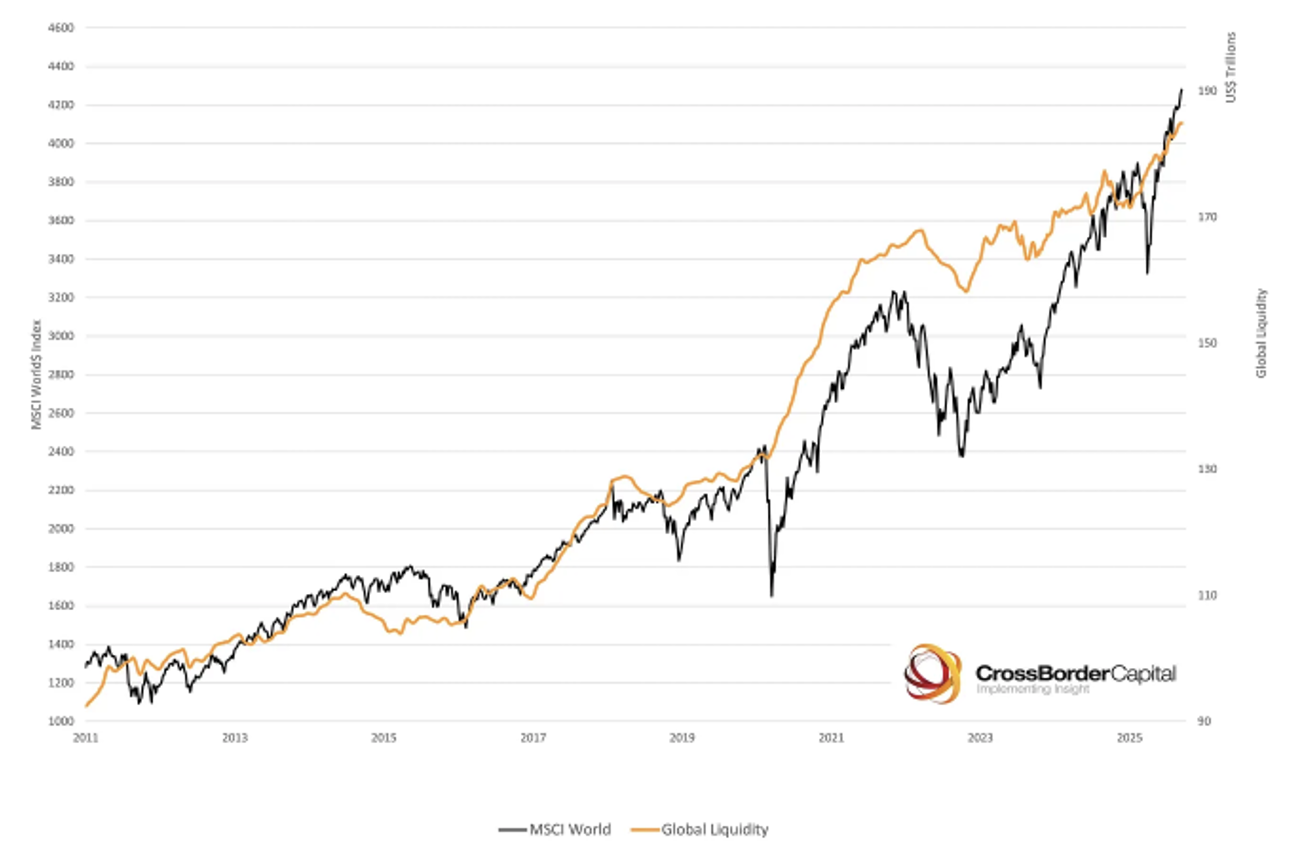
Source: CrossBorder Capital, US Federal Reserve, People’s Bank of China, ECB, Bank of Japan, Bank of England, MSCI
Liquidity fuels markets, and its rampant rise – fuelled by ongoing central bank programs – has unsurprisingly also produced speculative behaviour in peripheral ‘assets’ such as crypto tokens, meme stocks and even Pokémon cards. Concurrently, 209 listed U.S. companies that have not previously engaged in digital assets have adopted what are known as ‘bitcoin treasury strategies’, in which they allocate a portion of their cash and reserves toward the world’s largest cryptocurrency.
If it looks, smells and acts like a party, it probably is. Sooner or later, parties come to an end, and it’s not just the law of large numbers that retires the band, turns the lights on, and ends the party, although large numbers have fueled the latest tech dreaming.
According to Gartner Group and Deloitte, Global spending on AI could hit US$1.5 trillion in 2025 alone, with infrastructure sucking up the US$500-650 billion required to train and operate large language models (LLMs), such as cloud services and semiconductors. McKinsey and PwC have joined the party, cheering the spending on, by forecasting AI will add US$13-20 trillion to annual global gross domestix product (GDP) through productivity surges, innovation, and demand multipliers by 2030.
Gartner group estimates that total investment in LLMs, related infrastructure and other AI services will be US$1.48 trillion in 2025, up nearly 50 per cent on 2024.
According to others, the AI industry is receiving more capital than has been invested in the rest of the tech industry since the modern era began in 1956. That was the year the U.S. justice department’s consent decree with AT&T gave birth to Silicon Valley.
But the optimistic estimates arise even as 400-800 million jobs (up to 18 per cent of the global working-age population) are expected to be displaced by AI-inspired automation. One wonders who the AI customers will be?
Meanwhile, research from Epoch.ai indicates that in 2023, leading AI firms such as OpenAI, Google, and Anthropic collectively earned $1 billion from consumer-facing large language model (LLM) products. By 2024, this figure rose to around $4 billion. Epoch.ai projects that total industry revenue in 2025 could reach between $235 billion and $244 billion, but the bulk of these funds will be reinvested to build and maintain the infrastructure essential for LLM development and operation.
Maybe the investment and reinvestment are akin to the economics of Amazon, which, for many years, was reported to be making a loss, but the significant disparity between the hefty sums invested in infrastructure and the relatively modest income from AI software sales raises reasonable concerns. It cannot be sustained indefinitely. The stock market is rarely patient.
Of course, industry leaders are banking on a dramatic rise in consumer-driven revenue to close this gap, but the optimism may yet prove misplaced. For now, investors find solace in one company’s outlay becoming another’s revenue, if not profit – thanks in part to huge $100 million salaries.
Meanwhile AI has reportedly struggled in fields like legal services, education, healthcare, and software engineering, with results ranging from underwhelming to outrageous.
And let’s not forget that the process of investing in the leaders, followed by the laggards, ensures that everything AI-related becomes expensive and priced to win. But not all players can win.
I have seen this play out many times. When every company in a sector is priced like a winner, investors have disengaged from the reality of competitive capitalism. Not everyone can win, and to preserve their market valuations and dominance, each tech titan is vying for a commanding position. By definition, even a duopoly can harbour only two winners.
Could the market retreat?
As I have reported in previous blog posts, the argument the market isn’t a bubble and that it won’t burst are based on several observations or opinions. One is the weight of money argument. That old chestnut applied today says that as investors – mostly passively – pour money “into” the stock market it can do nothing but rise, especially if existing holders are reluctant to sell. Supporters then conclude prices can advance and retain those gains permanently.
A similar argument is often proffered in Australia. Trillions pouring into ‘superannuation’ sustains a rising market.
Of course, to agree with such a notion, one must overlook the market drawdowns that have occurred since passive exchange traded funds (ETFs) were introduced and those since Australia’s super system was established.
On September 24, Bank of America’s Savita Subramanian wrote to clients, “attributes … including less financial leverage, lower earnings volatility, increased efficiency and more stable margins than in decades past – help to support [today’s] towering valuations”, adding, “Perhaps we should anchor to today’s multiples as the new normal rather than expecting mean reversion to a bygone era.”
Those words must surely be a warning of the exuberant times we are in.
Back in the 1920s, the stock market was also ‘roaring’, and enjoying widespread optimism and even euphoria amid new innovations.
On October 15, 1929, after the market had experienced a nine-year rise, the first celebrity Yale economist, Irving Fisher, gave a speech in New York City.
That speech was reported by the New York Times on October 16, 1929;
“Stock prices have reached “what looks like a permanently high plateau,” Irving Fisher, Yale economist, told members of the Purchasing Agents Association at its monthly dinner meeting at the Builders Exchange Club, 2 Park Ave, last night… After discussing the rise in stock values during the past two years, Mr. Fisher declared realized and prospective increases in earnings, to a very large extent, had justified this rise, adding that “time will tell whether the increase will continue sufficiently to justify the present high level. I expect that it will.”
“While I will not attempt to make any exact forecast, I do not feel that there will soon, if ever, be a fifty or sixty-point break below present levels such as Mr. Babson has predicted.”
“While the tone of his address proper reflected a moderate optimism, in the informal questioning which followed Professor Fisher fell into almost unqualified optimism. In reply to one question, he declared that he expected “to see the stock market a good deal higher than it is today, within a few months.”
Fishers’ comments are remembered as one of the most notorious and inaccurate market forecasts in history. Just nine days later, beginning on Thursday October 24 and then on the following Monday and Tuesday, the Dow Jones had fallen a quarter. The glamour stocks of the age saw their values plummet.
By the end of the weekend of November 11, 1929, the index had plunged 40 per cent from its September high. The Dow Jones lost just shy of 90 per cent before finally bottoming out in July 1932
Bubbles and impacts
A bubble forms when prices disengage from even the most optimistic assumptions about what’s possible in the future. In other words, bubbles form when investors push stock prices higher without adjusting their expectations for future returns lower.
By this definition, and keeping in mind the higher the price you pay, the lower your return, a bubble is the mismatch between the returns investors expect based on price rises continuing (which can remain elevated and hopeful) and the returns expected based on valuation (which diminish as prices rise).
Bubbles are unsustainable because a bubble can only persist if the gap between hope and reality continues to grow exponentially. Of course, that’s impossible because eventually irrationality must face reality. Today, it would mean investors are happy to indefinitely own the most expensive stock market ever, even if growth slows or disappoints, knowing that the best return they can hope for is low single digits or even negative.
Someone always blinks first, and then the dam wall breaks.
As Hussman notes, “Avoiding the crash on the other side relies on the willingness of investors to accept the lowest long-term return prospects in U.S. history, forever. Extremely high prices may seem like a beautiful thing, but they’re a corrupt bargain. Unless you actually sell, the cost of “enjoying” record high valuations is that you are locking-in record low future rates of return.”
Implications
If you retired at the end of 1973 in the U.S and withdrew five per cent every year, you ran out of money thanks to something called sequencing risk. Large losses early in the investing journey are very hard to claw back in later years because the need to draw a pension ensures more units are sold at the lower levels, leaving fewer unit in the portfolio to make back the earlier declines.
If you’re over 60, can you afford to absorb that? What if Hussman is right and returns are negative, on average, over the next ten years? Of course, returns won’t be a negative six per cent every year. There will be big up years and maybe big down years. The risk of a big decline early in the retirement journey, however, is something every investor must seriously consider, given the stretched market values today.
If Hussman and history are right, having a high weight in equities today could be a “corrupt bargain”. Recent years’ returns, and their impact on your portfolio look rosey but they aren’t sustainable unless intrinsic valuations surge. Remember, the man who jumps off the roof of a 70-storey building thinks everything looks rosy as he passes the thirtieth floor.
At a minimum you should be rebalancing your portfolio. That seems like a painful idea, like cutting the roses to let the weeds through. But what if there was a garden bed offering similar returns to the long-run averages of the stock market, without the volatility associated with public markets.
What if there are funds that have produced returns of between nine and twenty per cent per year, have historically produced few if any negative months and have no stock market risk? Suddenly, the ‘weeds’ are looking pretty good, especially to those with a few too many roses.
Protecting yourself.
Nothing in your investment discipline should rely on the bubble bursting or the market crashing. Indeed, the stock market might not bust, and if it doesn’t, you would regret selling, possibly paying some tax, and missing out on further gains.
It is better, however, to be six months early than six minutes late, and so some rebalancing might be warranted. What I am suggesting is that you don’t ignore the risk.
In recent years, investors have earned returns comparable to those in the stock market without the volatility and without any public market risk. I am aware of a private credit fund that has been operating for eight years, with no property developer exposure, returning 9.55 per cent per annum, with no negative months and no exposure to the stock market. I am aware of another alternative fund, an arbitrage fund, whose investors have experienced only one negative month in its 52 months, have enjoyed returns of more than 20 per cent per annum, and again have had no stock market exposure.
Of course it is vital to point out that past returns are not a reliable guide to future returns, and that warning is also true for the stock market! Recent returns in the stock market are certainly not a reliable guide to future returns.
Rebalancing your portfolio is key – trimming potentially overpriced equities to reduce exposure and considering uncorrelated alternatives will be essential, especially if you are retired or retiring and can ill afford another significant market setback.
For more information, give David Buckland or Rhodri Taylor a call on (02) 8046 5000.
Disclaimer:
You should read the relevant Product Disclosure Statement (PDS) or Information Memorandum (IM) before deciding to acquire any investment products.
Past performance is not a reliable indicator of future performance. Returns are not guaranteed and so the value of an investment may rise or fall.
This information is provided by Montgomery Investment Management Pty Ltd (ACN 139 161 701 | AFSL 354564) (Montgomery) as authorised distributor of the Aura Core Income Fund (ARSN 658 462 652) (Fund). As authorised distributor, Montgomery is entitled to earn distribution fees paid by the investment manager and may be issued equity in the investment manager or entities associated with the investment manager.
The Aura Core Income Fund (ARSN 658 462 652)(Fund) is issued by One Managed Investment Funds Limited (ACN 117 400 987 | AFSL 297042) (OMIFL) as responsible entity for the Fund. Aura Credit Holdings Pty Ltd (ACN 656 261 200) (ACH) is the investment manager of the Fund and operates as a Corporate Authorised Representative (CAR 1297296) of Aura Capital Pty Ltd (ACN 143 700 887 | AFSL 366230).
You should obtain and carefully consider the Product Disclosure Statement (PDS) and Target Market Determination (TMD) for the Aura Core Income Fund before making any decision about whether to acquire or continue to hold an interest in the Fund. Applications for units in the Fund can only be made through the online application form that accompanies the PDS. The PDS, TMD, continuous disclosure notices and relevant application form may be obtained from www.oneinvestment.com.au/auracoreincomefund or from Montgomery.
The Aura Private Credit Income Fund is an unregistered managed investment scheme for wholesale clients only and is issued under an Information Memorandum by Aura Funds Management Pty Ltd (ABN 96 607 158 814, Authorised Representative No. 1233893 of Aura Capital Pty Ltd AFSL No. 366 230, ABN 48 143 700 887).
Any financial product advice given is of a general nature only. The information has been provided without taking into account the investment objectives, financial situation or needs of any particular investor. Therefore, before acting on the information contained in this report you should seek professional advice and consider whether the information is appropriate in light of your objectives, financial situation and needs.
Montgomery, ACH and OMIFL do not guarantee the performance of the Fund, the repayment of any capital or any rate of return. Investing in any financial product is subject to investment risk including possible loss. Past performance is not a reliable indicator of future performance. Information in this report may be based on information provided by third parties that may not have been verified.
Disclaimer:
The Digital Income Fund is available for wholesale investors only.
Performance of the Digital Income Fund – Digital Asset Class since its inception on 1 May 2021. Net returns after fees and expenses as at 31 July 2025 and assumes reinvestment of distributions.
This is general information and doesn’t take your personal circumstances into account, so seek independent advice before investing. Investing involves risk, including the possible loss of principal. Past performance is not a reliable indicator of future performance.
Diversification does not ensure a profit nor guarantee against a loss. Montgomery Investment Management holds AFSL number 354564.
Roger Montgomery is the Founder and Chairman of Montgomery Investment Management. Roger has over three decades of experience in funds management and related activities, including equities analysis, equity and derivatives strategy, trading and stockbroking. Prior to establishing Montgomery, Roger held positions at Ord Minnett Jardine Fleming, BT (Australia) Limited and Merrill Lynch.
He is also author of best-selling investment guide-book for the stock market, Value.able – how to value the best stocks and buy them for less than they are worth.
Roger appears regularly on television and radio, and in the press, including ABC radio and TV, The Australian and Ausbiz. View upcoming media appearances.
This post was contributed by a representative of Montgomery Investment Management Pty Limited (AFSL No. 354564). The principal purpose of this post is to provide factual information and not provide financial product advice. Additionally, the information provided is not intended to provide any recommendation or opinion about any financial product. Any commentary and statements of opinion however may contain general advice only that is prepared without taking into account your personal objectives, financial circumstances or needs. Because of this, before acting on any of the information provided, you should always consider its appropriateness in light of your personal objectives, financial circumstances and needs and should consider seeking independent advice from a financial advisor if necessary before making any decisions. This post specifically excludes personal advice.