Again with Investment Risk
As regular readers will know only too well, one of my pet peeves in investment markets is a lack of understanding of the role played by chance.
A further rant on this topic follows.
The issue – in a nutshell – is this: The performance of any risky investment strategy will be some combination of merit and luck. As the timeframe gets longer, we can expect the good and bad luck to increasingly balance out, such that the merit component becomes a more important driver of the result. Most people have no trouble with this as a concept, but the timeframes needed for this process to work tend to be much longer than many appreciate.
We can illustrate the scale of the problem with a simple simulation. We construct an investment strategy that has a 10 per cent expected return with 10 per cent volatility – the sorts of numbers that might be appropriate for equity investments. Then, using returns drawn at random from a normal distribution, we run this same strategy over ten years, and we repeat the whole exercise ten times.
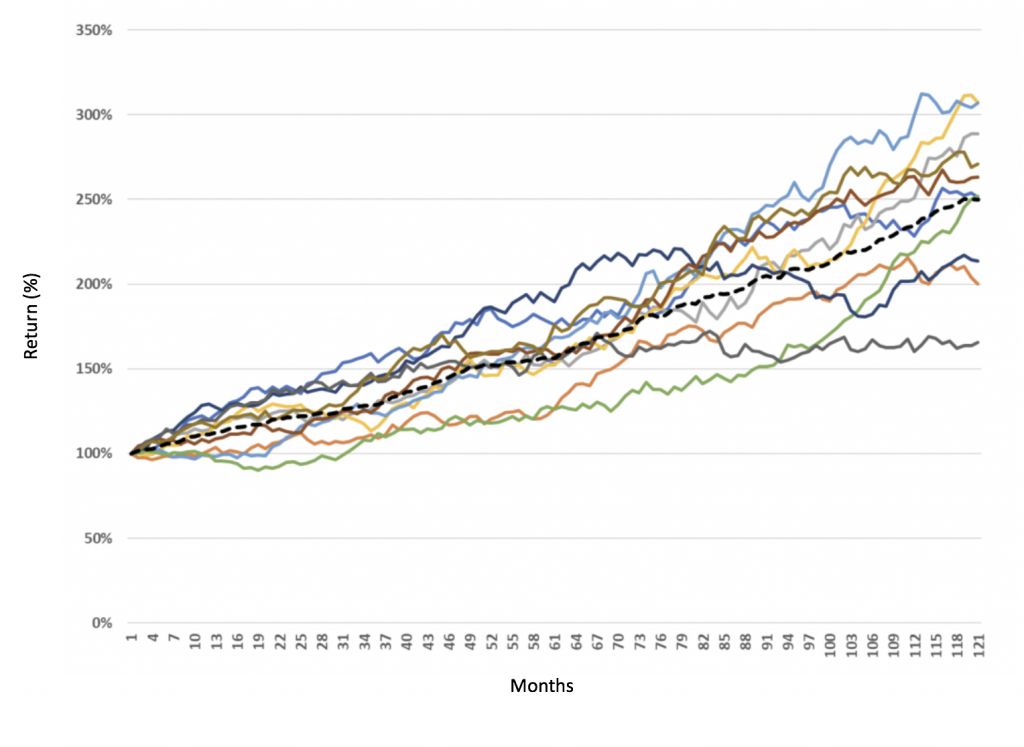
Here are the results of our ten trials:
10 Investment Strategies over 10 years
The average of all ten is shown in the dotted black line. As you can see, after ten years the average result is a gain of near 150 per cent, and at that time around seven of our ten trials have delivered a total result of between +100 per cent and +200 per cent – equivalent to between (roughly) 7 per cent p.a. and 12 per cent p.a.
However, the picture varies significantly over the intervening period. Our green line, for example, was looking terrible for most of the trial duration, posting negative returns in the first couple of years and trailing badly after 5 or 6 years, before drawing back to the average in the later years.
Our dark blue line, on the other hand, was the clear leader early on, before turning in a miserable few years to finish in the bottom half of the pack, and below the green line.
Imagine an investor who initially chose to invest in the green line, and then in year 5 or 6 conducts a portfolio review, having looked at the performance of the blue line. Human nature being what it is, our investor will feel a strong compulsion to extrapolate performance and will switch from the green line to the blue line. In this way, human nature destroys a lot of wealth for a great number of investors.
The numbers we used in our simulation are arguably towards the higher end, and for well-diversified equity investments we could justify lower volatility[1]numbers and shorter time frames. However, in evaluating the performance of any risky investment, it is important to understand the level of variability inherent in performance, how long a timeframe is sensible, and whether market conditions over a particular period may have provided headwinds or tailwinds (i.e. good or bad luck).
Unfortunately, there are no quick and easy solutions here. Whether it’s individual stocks or managed funds, making sound long-term investment decisions usually requires thorough research, some thoughtful analysis and, more often than not, a good measure of patience.
[1]Or to be more rigorous, tracking error

Hi Tim, I literally subscribe to your philosophy.
To check the hypothesis though, does your model show luck does average out over the long run, with all lines converging?
And if one manager in the model has the benefit of say 3% p.a. outperformance due to merit, how often does that line finish above the rest, in other words can you show merit outweighs luck?
That’s a good question, Dave. The lines (unfortunately) don’t converge in an absolute sense – the spread continues to widen with time. However, the spread does become smaller relative to the merit. In mathematical terms, the spread increases in proportion to the square root of elapsed time, while the expected return increases directly in proportion to elapsed time (actually slightly exponential due to compounding). For a more intuituive take on this, you will see from the chart than in the early years some of the lines are zero or negative – meaning that luck has completely outweighed merit. By the end of the period however, merit has lifted all of the lines significantly into positive territory.