
A note on timing (and underperformance)
Are you (or is someone you know) guilty of trying to ‘time the market’? Have you ever attempted to sell your shares when trouble looks like brewing, only to buy back into the market when the sky has cleared and all looks safe?
With the recent uptick in share market volatility over the past few weeks, we’ve come across numerous situations whereby investors have attempted – or are attempting – to do just that. It’s a situation that continues to rear is head each and every time the market has a bit of a wobble.
The goal is to try and boost longer-term returns by protecting against prevailing downside risks, and buying when there is upside potential. Seems simple enough, right? Well, perhaps not.
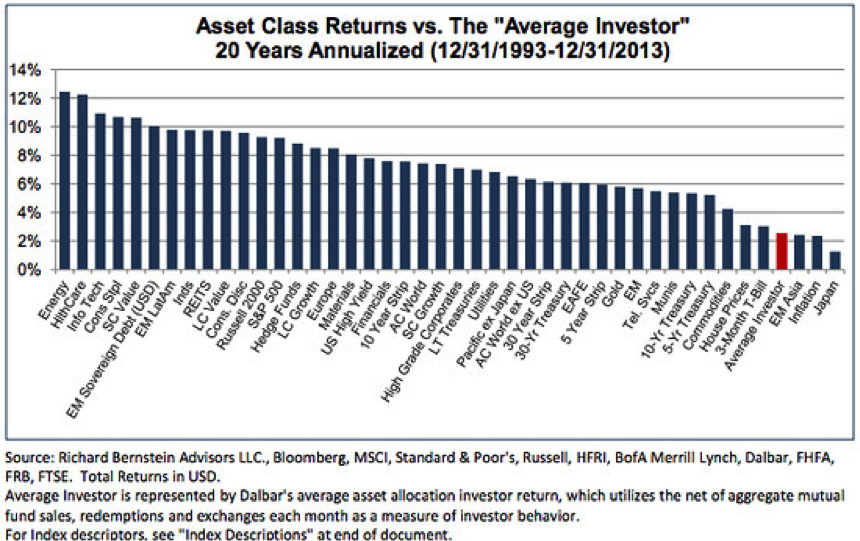
A recent US study has analysed the patterns of the average (mum and dad) investor and concluded that those that try and ‘time their exit and entry points’ by selling when markets show an increase in volatility and attempting to buy back in when the clouds clear, significantly undermines an ability to make investment progress.
This is not the first time such chronic underperformance has been observed. Famed economist and Nobel Laureate Eugene F. Fama similarly concluded that investors’ intuition and actions often prove counter-productive: “Money is like soap, the more you handle it the less you will have.”
Whilst a seemingly simple and achievable strategy, investors’ timing of asset allocation decisions (moving in and out of cash, for example) is particularly poor, and what these studies show is that the opposite to what an investor should be trying to do actually occurs. That is they end up buying assets such as shares when they are overvalued, and selling when they are undervalued. In other words, an attempt to ‘time the market’ actually results, on average, in an investor buying high and selling low.
A friend who I have known for many, many years asked me just the other day: “With the market falling, is now a good time to invest into your fund?” To this I simply replied: “Do the opposite to what everyone else is doing”. I hope he listened.
It may sound like a flippant reply, but it’s exactly what we have been doing here at Montgomery. With the market down 10 per cent since September 2, we have taken the opportunity to deploy some of the cash we’ve built up over recent months from selling a number of holdings in The Fund that to us, appeared expensive.
This is our investment process in action – attempting to sell high and buy low. For as history suggests, the best investments often prove to be the ones others have shunned.
Humans, however, are hard-wired to focus on recent events and to allow emotion to influence their thinking when making key investment decisions. But basing a decision on things that haven’t happened yet because it’s natural to assume that what has been happening in the recent past will continue, is clearly unsound investment practice – and one which will only lead you to generating mediocre results.
Flip that logic on its head and instead understand that today’s volatility tends to be forgotten once more promising news is delivered, and you’ll be much better positioned emotionally to invest when everyone else is running for the door and not the other way around.
This post was contributed by a representative of Montgomery Investment Management Pty Limited (AFSL No. 354564). The principal purpose of this post is to provide factual information and not provide financial product advice. Additionally, the information provided is not intended to provide any recommendation or opinion about any financial product. Any commentary and statements of opinion however may contain general advice only that is prepared without taking into account your personal objectives, financial circumstances or needs. Because of this, before acting on any of the information provided, you should always consider its appropriateness in light of your personal objectives, financial circumstances and needs and should consider seeking independent advice from a financial advisor if necessary before making any decisions. This post specifically excludes personal advice.
INVEST WITH MONTGOMERY
I was lucky enough to understand the philosophy before i was needed to make decisions. I started investing in the bull market so never really had an experience of a “crash” until the GFC.
I remember during that time, being told that i should be selling my shares at the height of the GFC but was doing the precise opposite. To many mum & dads and without wanting to be mean “unsophisticated investors” this appeared to be a strange decision. Buying at the height of a “crisis” where everyone else was selling. The result was a series of investments which more than doubled over a time frame and managed to fund the wedding to my wife so we could use our savings to purchase our first home near a beach with a easily manageable mortgage and also go a long honeymoon to Europe.
I think anyone my age would have been happy with that outcomer and all came from doing, as Russell said “the opposite to what everyone else is doing”.
Obviously there are limits to this simple rule but if you stick to quality businesses than it is a good one to follow.
Timing the daily actions of the stock market is near impossible and many have tried and failed over time; how many successful day traders are there, forget the idea but determine a strategy that either allows for an exit with all capital in hand or take out insurance.
I was told many years ago, “If you can justify your intended position by using sound mathematics, then proceed”. Hence over time like Roger I developed a linear based Intrinsic Value analysis that has been back tested with good results and align reasonably well with Rogers exponentially based IV.
Deploying IV solves the market entry point but what about an exit point prior to a market melt down?
If the stocks owned are reasonably good value and are profitable over the cycle, then a sale will create a tax payment, hence a loss of equity, but holding the stocks throughout the cycle is likely to produce a hefty loss of equity during the fourth leg.
Is there a way of determining where the stock market is placed in the market cycle?
Forecasting market directional changes is incredibly difficult.
Over several years I have tested many of the market indicators, overbought, overvalued, macd etc, and all were of little value in determining where the market cycle was at any point in time, so a new method was required.
The objective was to find a mathematical method that used the daily index data, but manipulated the data to highlight the four legs of the stock market cycle. Obviously this was not an easy task, nor was it quickly developed. The value of this cycle analysis is the warning of an impending market change of direction that may destroy years of wealth creation in a matter of months.
History tells us there are few individuals who accurately forecasts market changes over decades, the most notable are W. Buffett and G. Soros, both of whom are currently prepared.
The cycle analysis was initially based on the DJIA and back tested over one hundred years to verify accuracy. Just as the stock market cycles vary over time so does the cycle analysis, but it is always timely. The cycle analysis produced several graphs as follows, two long period indicators, two medium period indicators and three coincident indicators.
Using the most sensitive coincident indicator based on the DJIA the following information may be of interest.
YEAR CYCLE ANALYSIS TOP MARKET TOP
1929 5 Dec 1928 3 Sep 1929
1973 13 Dec 1972 11 Jan 1973
1987 26 Aug 1987 25 Aug 1987
2007 24 May 2007 9 Oct 2007
2014 28 May 2013 19 Sep 2014
Of the fourteen market indices now being tracked the DJIA was one of the first to turn into the fourth cycle leg of the cycle.
So what does the cycle analysis currently indicate?
Comparing previous cycles with the current cycle data suggests the market has been extensively drawn out most probably because of the massive amount of liquidity injected into the system. The US Federal Reserve Bank bought bonds from banks which on the same day bought stocks, Company stock buy backs were quite huge in historical terms and diluted Intrinsic Value, meanwhile margin loans are now at the most elevated level ever recorded whilst producing the most negative balances in margin accounts ever recorded. All of this has stretched the market timing but not the inevitable market cycle. The cycle analysis top to the market top is at the maximum historical range and the cycle data is in decline.
Graphs of the cycle data fourth leg that includes the 50 day EMA and the 200 day EMA are demonstrating the same qualities that all previous ends of cycles have previously shown where by the cycle data, 50 day EMA and the 200 day EMA have inverted. Interrupting this inversion would require several more days of market advances but that would not change the fourth leg downward trend. Reversing the trend would require a massive financial input and probably more than previously.
With the cycle analysis giving a warning of an impending market change of direction provides time for creating the portfolio insurance either by selling some equities or buying put options staggered over time.
What could possibly go wrong.
Well done Andrew. We were not as aggressive as you, we sold progressively over a number of months, but at one stage, we held close to 40% cash in The Montgomery Private Fund. Thanks for your post and we are naturally excited to see the philosophy working in practice.
So in your own way you are timing the market
Hi Jim, that’s not really true but I see your angle. The selling of one individual business because we believe it to be expensive is not an attempt to try and predict where the market as a whole, made up of 500 individual business in case of the All Ordinaries, may trade.
It’s human nature to jump ship when it seems to be sinking. I guess it’s this reaction to the market correcting that actually creates opportunity for the well informed investor. I remember reading one of Ben Graham’s books a few years ago that described in general the lower the stock market went the less riskier the market actually became!
Very true Paul. As prices fall, assuming the cash flows of the business you own will remain unchanged, value remains constant. As prices fall, you can buy more of those future cashflow for less (a lower risk purchase), which is what I believe BG was referring to.