Higher interest rates equal lower PEs
When I joined the financial market in the 1980’s as a young graduate, I was given a simple rule from an old-timer which went something like this: “Son, the market PE plus long-term inflationary expectations should equal 20.” At the time, Australia’s inflation rate was coming down from 12 per cent, and the market PE approximated 8x. As global inflationary expectations entered an almighty structural decline to well under 2 per cent, market PEs went through the roof.
Western World economies are now seeing their rates of inflation hitting between 30-to-40-year highs and examples include New Zealand at 6.9 per cent; the UK at 7.0 per cent; Germany at 7.3 per cent and the US at 8.5 per cent. Most Central Banks have moved very late in their tightening cycle and cash rates of around 1.0 to 1.5 per cent are still very low by historical standards.
Australia’s ridiculously low cash rate at 0.35 per cent – after Tuesday’s 0.25 per cent increase – compares, for example, with the RBA’s “Emergency Low” cash rate of 3.0 per cent implemented on the back of the Global Financial Crisis over 13 years ago.
US ten-year treasury bonds have risen from approximately 0.5 per cent in mid-2020 and are now 3.0 per cent. They have effectively doubled from 1.5 per cent in four months as the concept of “transitory inflation” has been reduced to rubble from the war in Ukraine pushing up commodity prices, continued supply bottlenecks and the general tightness of the labour markets as many economies exit COVID-19.
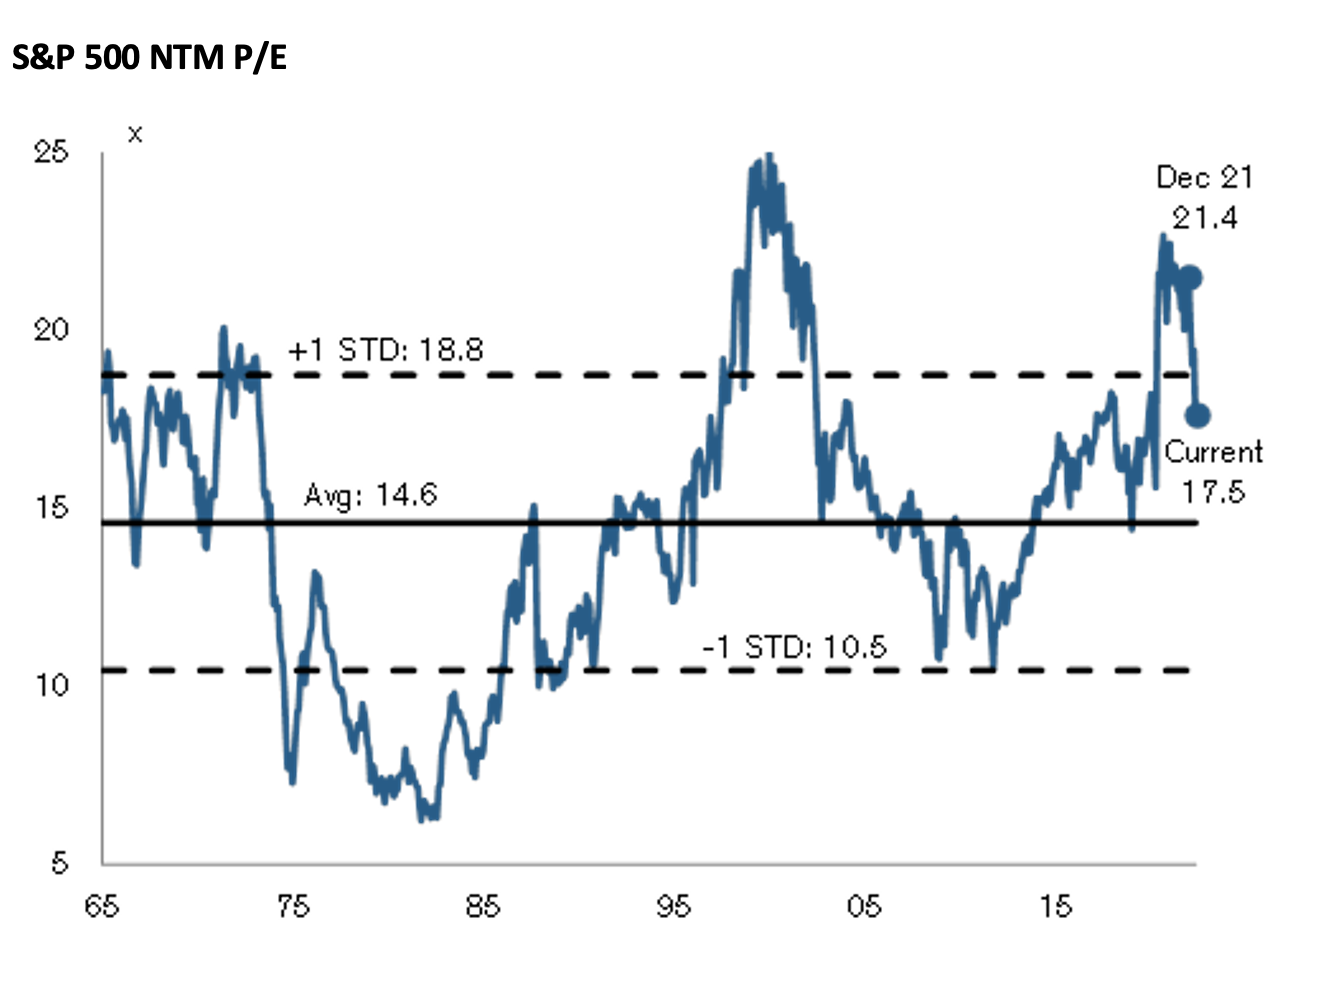
Since the start of the 2022 year, the forward outlook for US earnings has improved by an impressive 5 per cent and at the same time PEs have declined by 18 per cent with the S&P 500 multiple falling from 21.4x to 17.5x – see below.
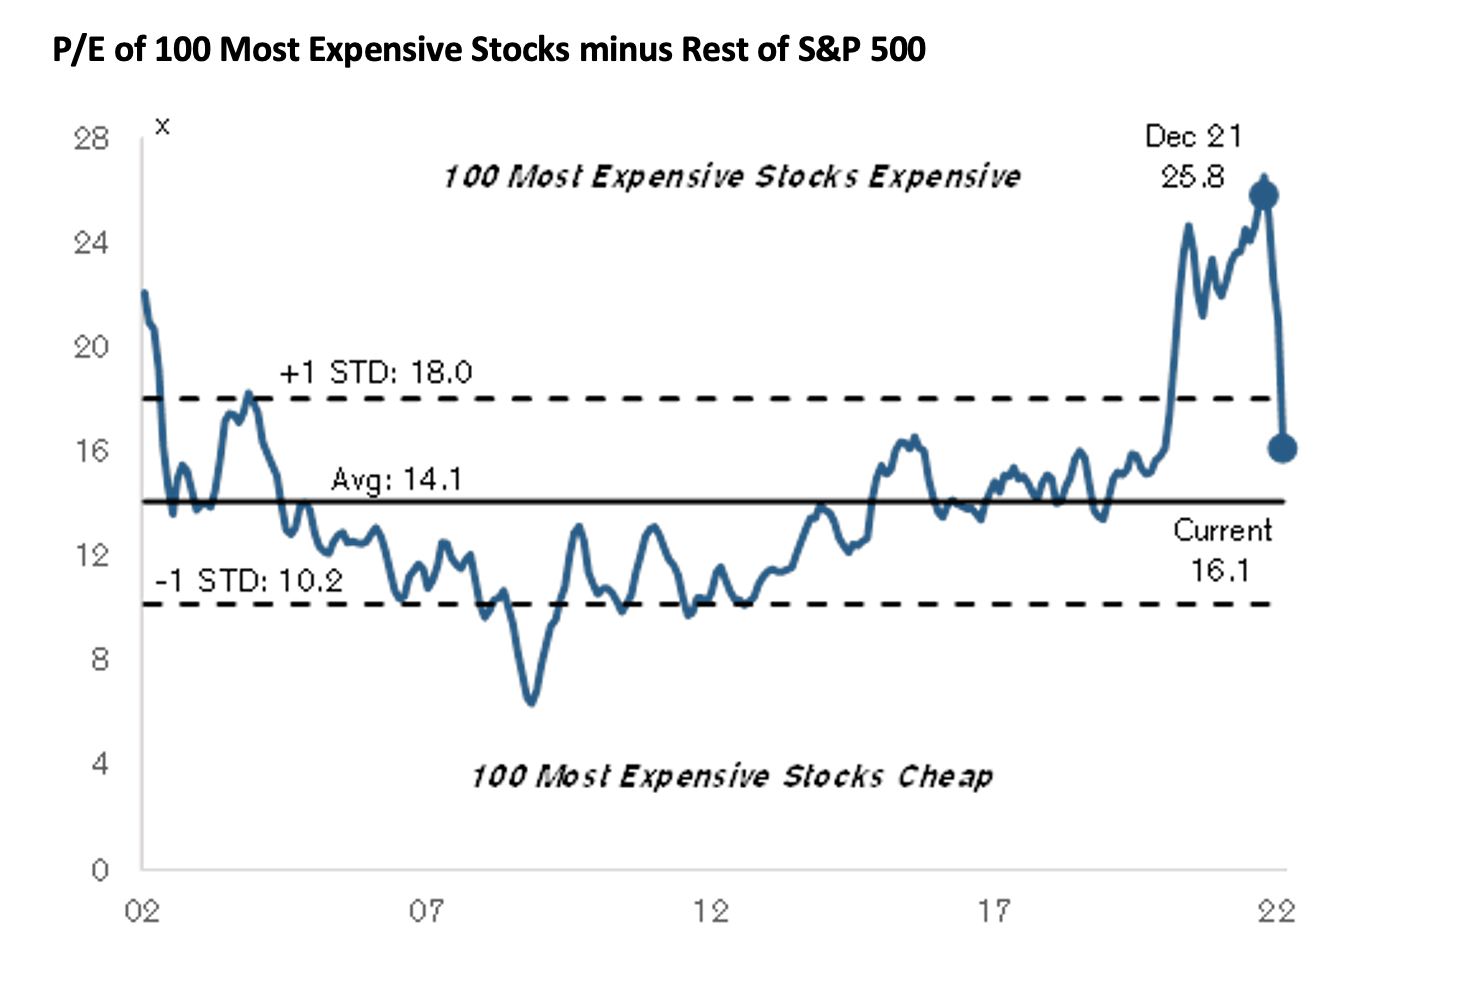
According to Credit Suisse, over the past 20 years the 100 most expensive stocks in the S&P 500 have traded at a multiple premium of 14x compared to the remaining 400 (less expensive) stocks. At the start of the 2022 year, this premium was 26x (43x versus 17x), nearly double the long-term average.
The market’s correction is largely the result of the de-rating of these extremely overvalued names and over the past four months this gap has declined from 26x to 16x (30x versus 14x), much closer to the historical average (of 14x).
The 30 per cent compression in the PE of the 100 most expensive stocks (from 43x to 30x) seems to have gone a long way in the re-normalisation process and has somewhat alleviated the valuation distortions relative to the remaining 400 (less expensive) stocks.
Year to date, the total return of the 100 most expensive stocks in the S&P500 Index has been negative 22 per cent whilst for the 400 less expensive stocks it has been negative 5 per cent, for an overall decline of 13 per cent.
And judging by the performance of many other indices, this dramatic PE de-rating of the most expensive stocks (relative to the less expensive stocks) seems to be a common thread.
