How COVID-19 has changed the way we spend
New data from the Commonwealth Bank and ANZ confirms what you likely already knew – COVID-19 has spurred a major change in our spending habits. However, some of the retailers that have thrived during the lockdowns may find the going tougher in the months ahead.
There are a variety of lesser known competitive advantages conferred by monopoly and our largest Australian banks enjoy one of them – the benefit of inertia. With the inconvenience of changing banks being far greater than the perceived benefit, customers typically don’t move. And don’t forget most adults must have a bank account. Consequently, bank databases are a rich source of reliable insights into the state of various sectors of the economy.
Both the ANZ and the CBA have just released insights gleaned from their spending and credit card data.
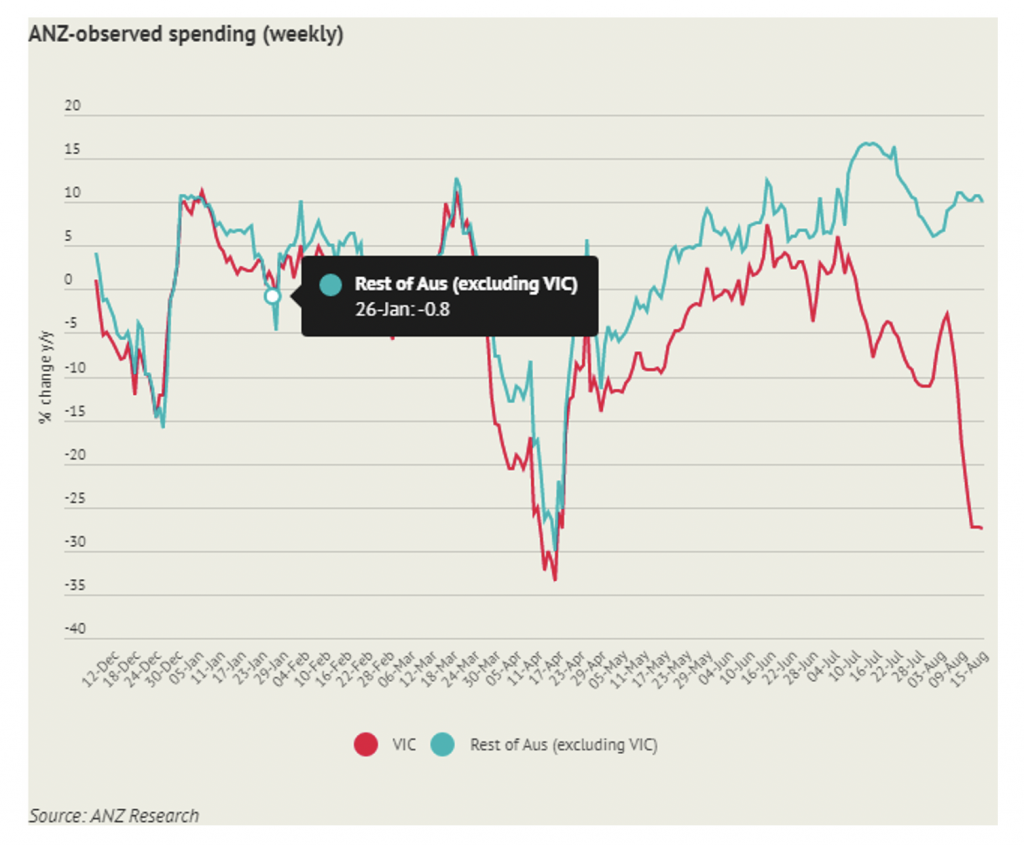
Figure 1. ANZ weekly spending data
With the exception of Victoria, ANZ’s spending data revealed growth in spending has stabilised. In other words, since the beginning of June, spending has been growing, on average, at a rate of a little less than 10 per cent year-on-year. Victoria’s second lockdown of course, under Chairman Dan, has torn a gaping hole in spending growth rates but of course this will surge when the lockdowns end.
On the other hand, there will be some negative impact from the tapering in JobKeeper and the end of both the Coronavirus supplement to JobSeeker and emergency access to superannuation.
There is some optimism among fund managers that sell-side analysts might be too bearish about the drop in spending from tapering JobKeeper and the end of the COVID supplement to JobSeeker. That relative optimism comes from the positive impact of a mix shift stemming from a lack of overseas travel and the banning of, or restrictions on, various forms of entertainment as a spending outlet. The money normally spent on, and while, travelling overseas will be spent domestically. And the money normally spent going to pubs and clubs, concerts and cinemas, will be spent on other categories domestically.
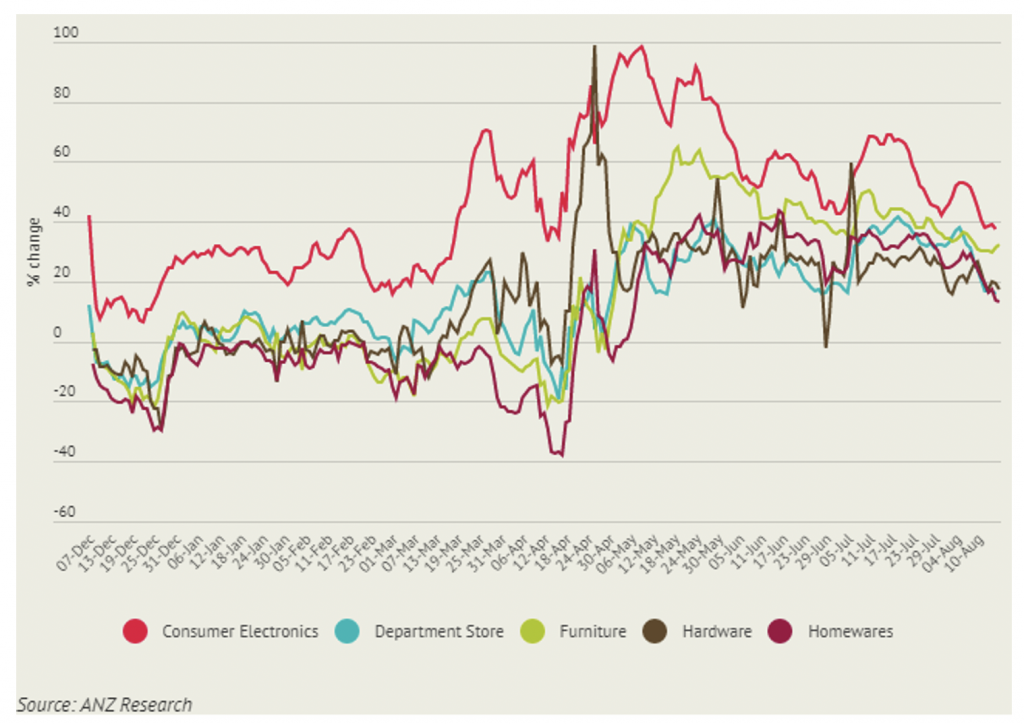
Figure 2. Spending by category
The absence of alternatives for spending is reflected in the ANZ spending-by-category data, which reveals growth rates for spending on electronics, in department stores, and on furniture, hardware and homewares vary between just less than 20 per cent to almost 40 per cent year-on-year.
All categories are still growing at faster rates than prior to the pandemic. Sharp-eyed viewers however will notice the general decline in growth rates since May. In many cases these items aren’t replaced frequently, and with many customers having already purchased their new fridge, sofa, dining set and widescreen TV, demand is becoming sated.
If the ‘economics of enough’ coincides with the tapering of JobKeeper, the decline in spending in these categories may accelerate.
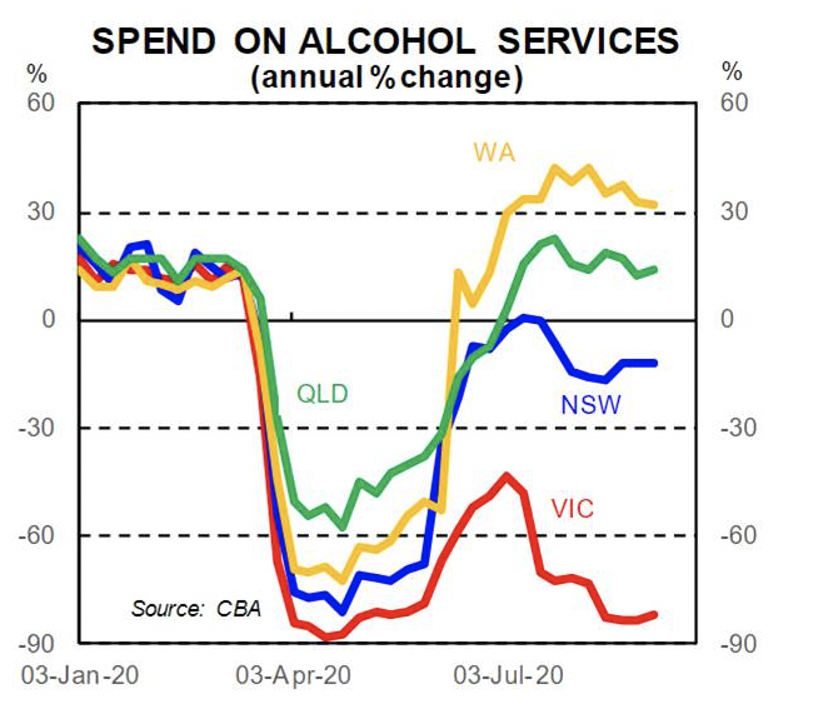
The CBA’s data reveals much of the spending growth is driven by Western Australia, Queensland and Tasmania – three states with closed borders and relatively normal levels of activity. As Figure 3 (Spending on alcohol services) reveals, Western Australia and Queensland appear to be celebrating quite hard. We know they are big drinking states but they are presently increasing their spending compared to a year before, at rates faster than before the pandemic.
Figure 3. CBA card data spending on alcohol services
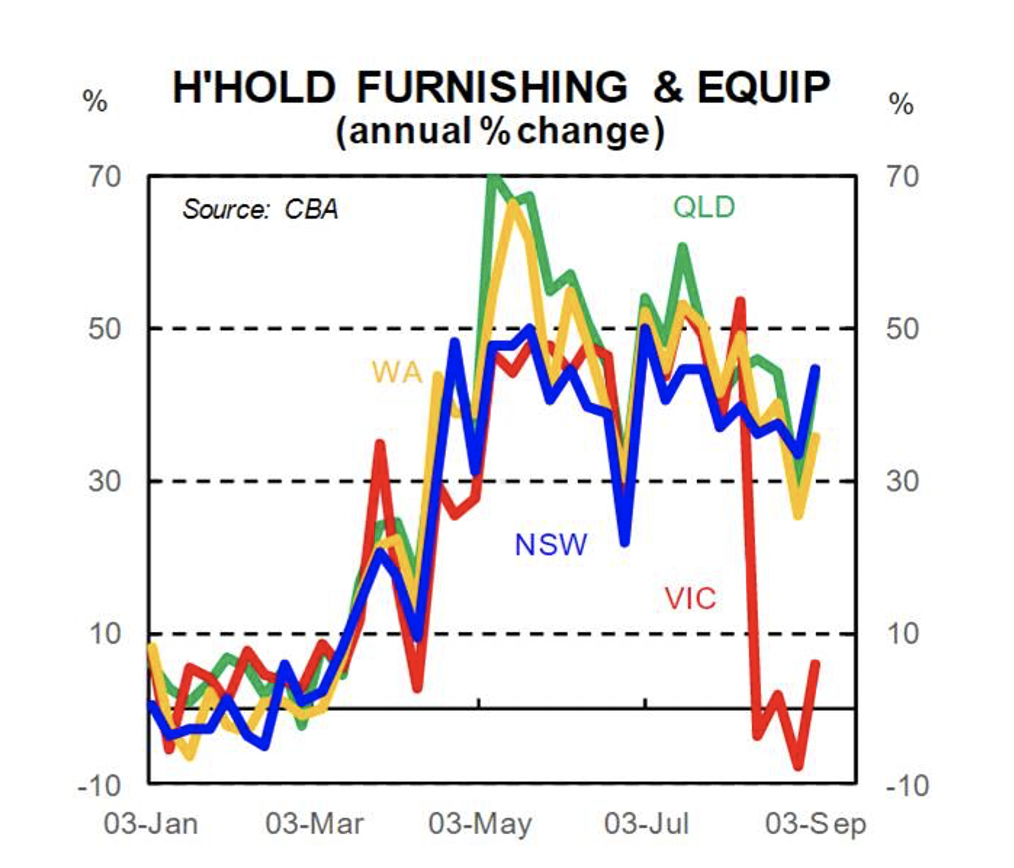
Figure 4 reflects a similar picture to the ANZ spending by category data, showing a tapering of the spending growth rates being recorded before the pandemic but still strong growth given the absence of alternatives such as entertainment and travel.
Figure 4. CBA card spending on household furniture and equipment by state
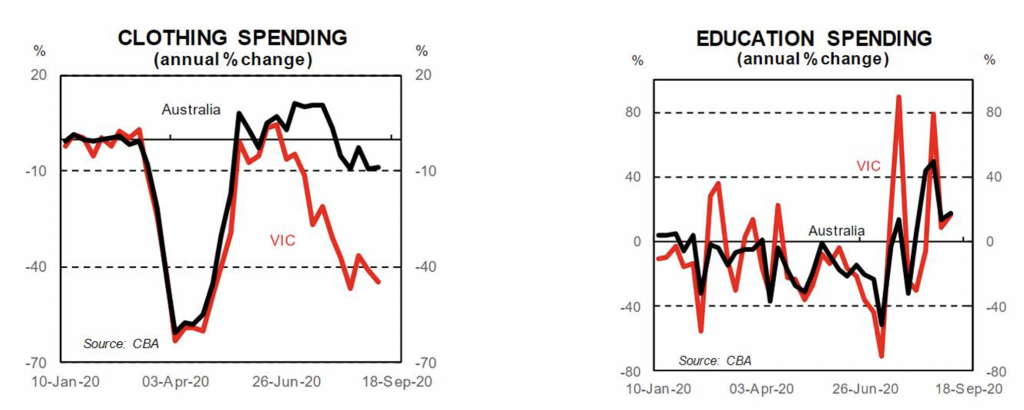
Figure 5. CBA card spending on clothing and education
The spending data, from CBA card holders, on clothing (Figure 5) reveals a problem for fashion chains. With fewer people in the most populous states going out for dinner, concerts and parties, there are fewer reasons to dress up. Consequently, spending growth rates on clothing is below the growth rates recorded prior to the pandemic, and note that the Australia data includes the Victorian experience and so is being dragged down by the absence of that state’s significant spending on fashion.
On the other hand, lockdown measures by state governments, schools and universities have meant greater spending on schooling from home. Unsurprisingly, spending growth in the education category remains well above pre-COVID levels.
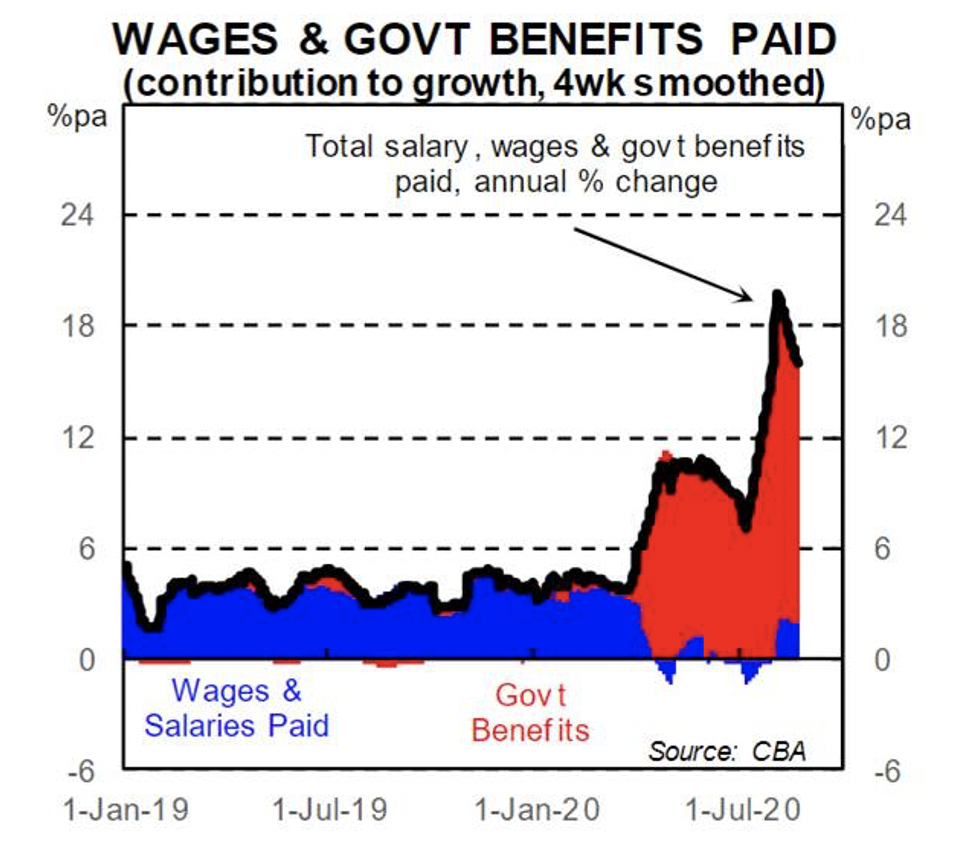
Probably the most important chart, however, is revealed in Figure 6.
Figure 6. Turbocharged. CBA tracked income sources. Growth in wages and government benefits
Figure 6 reveals the drop in wages and salaries (blue) has been more than offset by a rapid surge in government benefits (red). While these are growth rates, rather than absolute amounts, it is nevertheless obvious that the growth rates in all spending categories have been sustained by the governments response to the economic crisis.
It also appears evident that the growth rate is slowing and will quite possibly be zero or negative by this time next year (depending on what the government pulls out of its hat in the October budget and thereafter and whether a vaccine is found and distributed).
Investors who might be capitalising (projecting into the future) the recent growth rates reported by retailers during reporting season may want to be very careful indeed.
