Are you taking a longer-term view?
Currently, the US S&P 500 stands at 2,870 points, down 15 per cent from its February 2020 peak. (Meanwhile, the Australian All Ordinaries Index at 5,450 points is 25 per cent below its peak). On most fundamentals, markets have justified high valuations on the back of historically low interest rates.
The enormous success of the top five US technology stocks, Microsoft (US$1.36 trillion), Apple (US$1.27 trillion), Amazon (US$1.16 trillion), Alphabet (US$904 billion) and Facebook (US$584 billion) – which currently account for a collective 21.5 per cent of the S&P 500 (US$24.5 trillion ) – often means investors lose sight of what is happening in the broad economy.
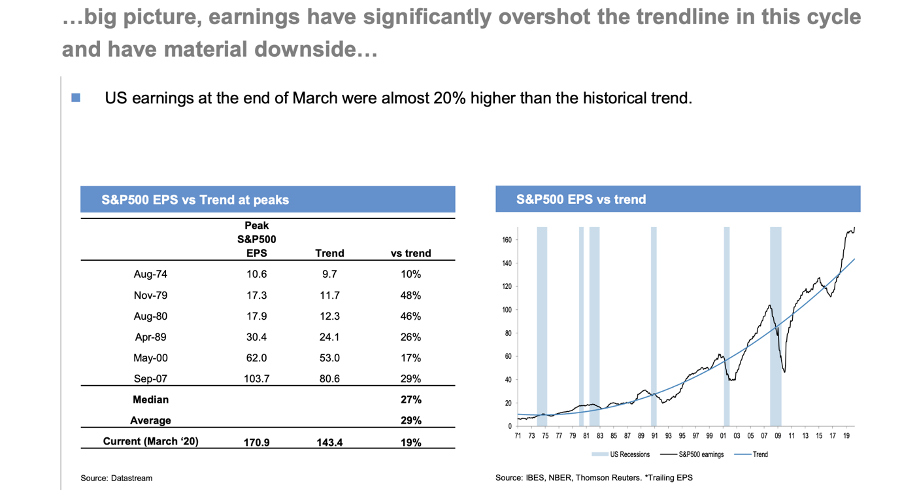
As illustrated below, businesses have been materially “over-earning” in the post GFC environment, often to the detriment of the labour force. How vulnerable are US earnings forecasts, given they have significantly overshot the trendline in this cycle and appear to have material downside?
Source: JP Morgan
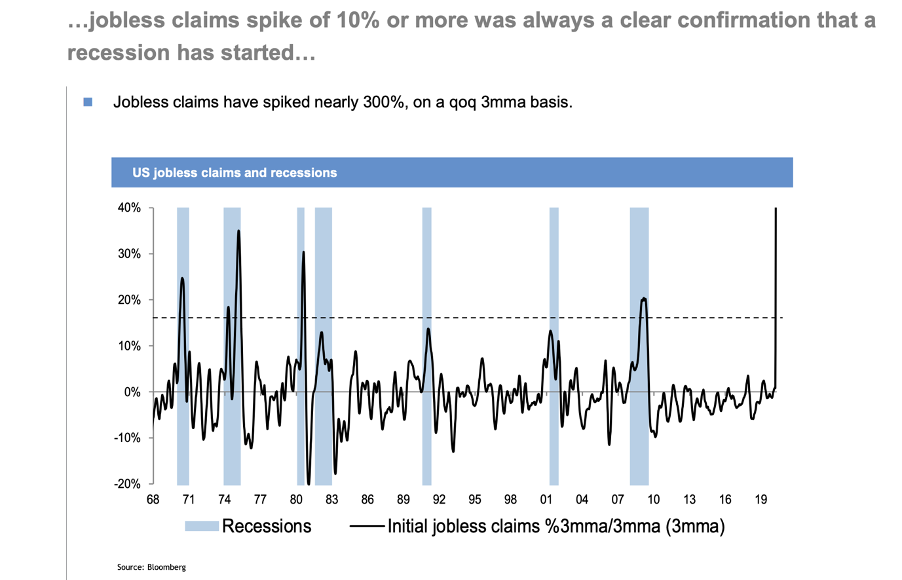
Near term unemployment will likely exceed 10 per cent in many major economies – the consensus forecast in the US is 16 per cent – and with the consumer accounting for 70 per cent of GDP, a return to normalcy seems some way off. Deferred capital expenditure, reduced dividends and cancellation of buy-backs, and cost-cutting initiatives will likely create second order impacts.
Source: JP Morgan
As countries partially reopen their economies it appears the authorities will accept a (small) bounce in the level of COVID-19 infection, but how will this affect consumer behaviour? Some companies’ trading results will return to pre-pandemic levels quite quickly, but for most it seems a less optimistic outlook is most likely.
In terms of Australia, the pull-up effect from China was a saviour during the Global Financial Crisis of 2008-2009. However, the high frequency data available since China’s return to work on 10 February and the lockdown for the Hubei Province on 27 March being lifted is, on balance, relatively sober.
Examples include:
- China’s daily passenger traffic has rebounded from negative 66 per cent year-on year to negative 55 per cent (at 30 April) year-on-year.
- Daily coal consumption is down 20 per cent on the 2010-2019 average.
- In terms of housing transactions, the market did rebound after the restrictions were lifted, but activity is now running at around half the pace of the 2015-2019 average.
- Outbound and inbound shipping is typically down 5 per cent and 15 per cent, year on year.
- Air traffic has been reasonably flat over the past two months.
- According to TomTom.com, traffic congestion in Wuhan on 1 May 2020 is down 61 per cent on a year ago.
We will keep readers updated as the impact from China on Australia’s economy is crucial to our outlook.

