
Investment Returns: 1900-2017
Any investor looking for long term context should read the Credit Suisse Global Investment Returns Yearbook 2018 by Elroy Dimson, Paul Marsh and Mike Staunton of the London Business School. They have analysed investment returns, volatility, and inflation from 23 countries since 1900.
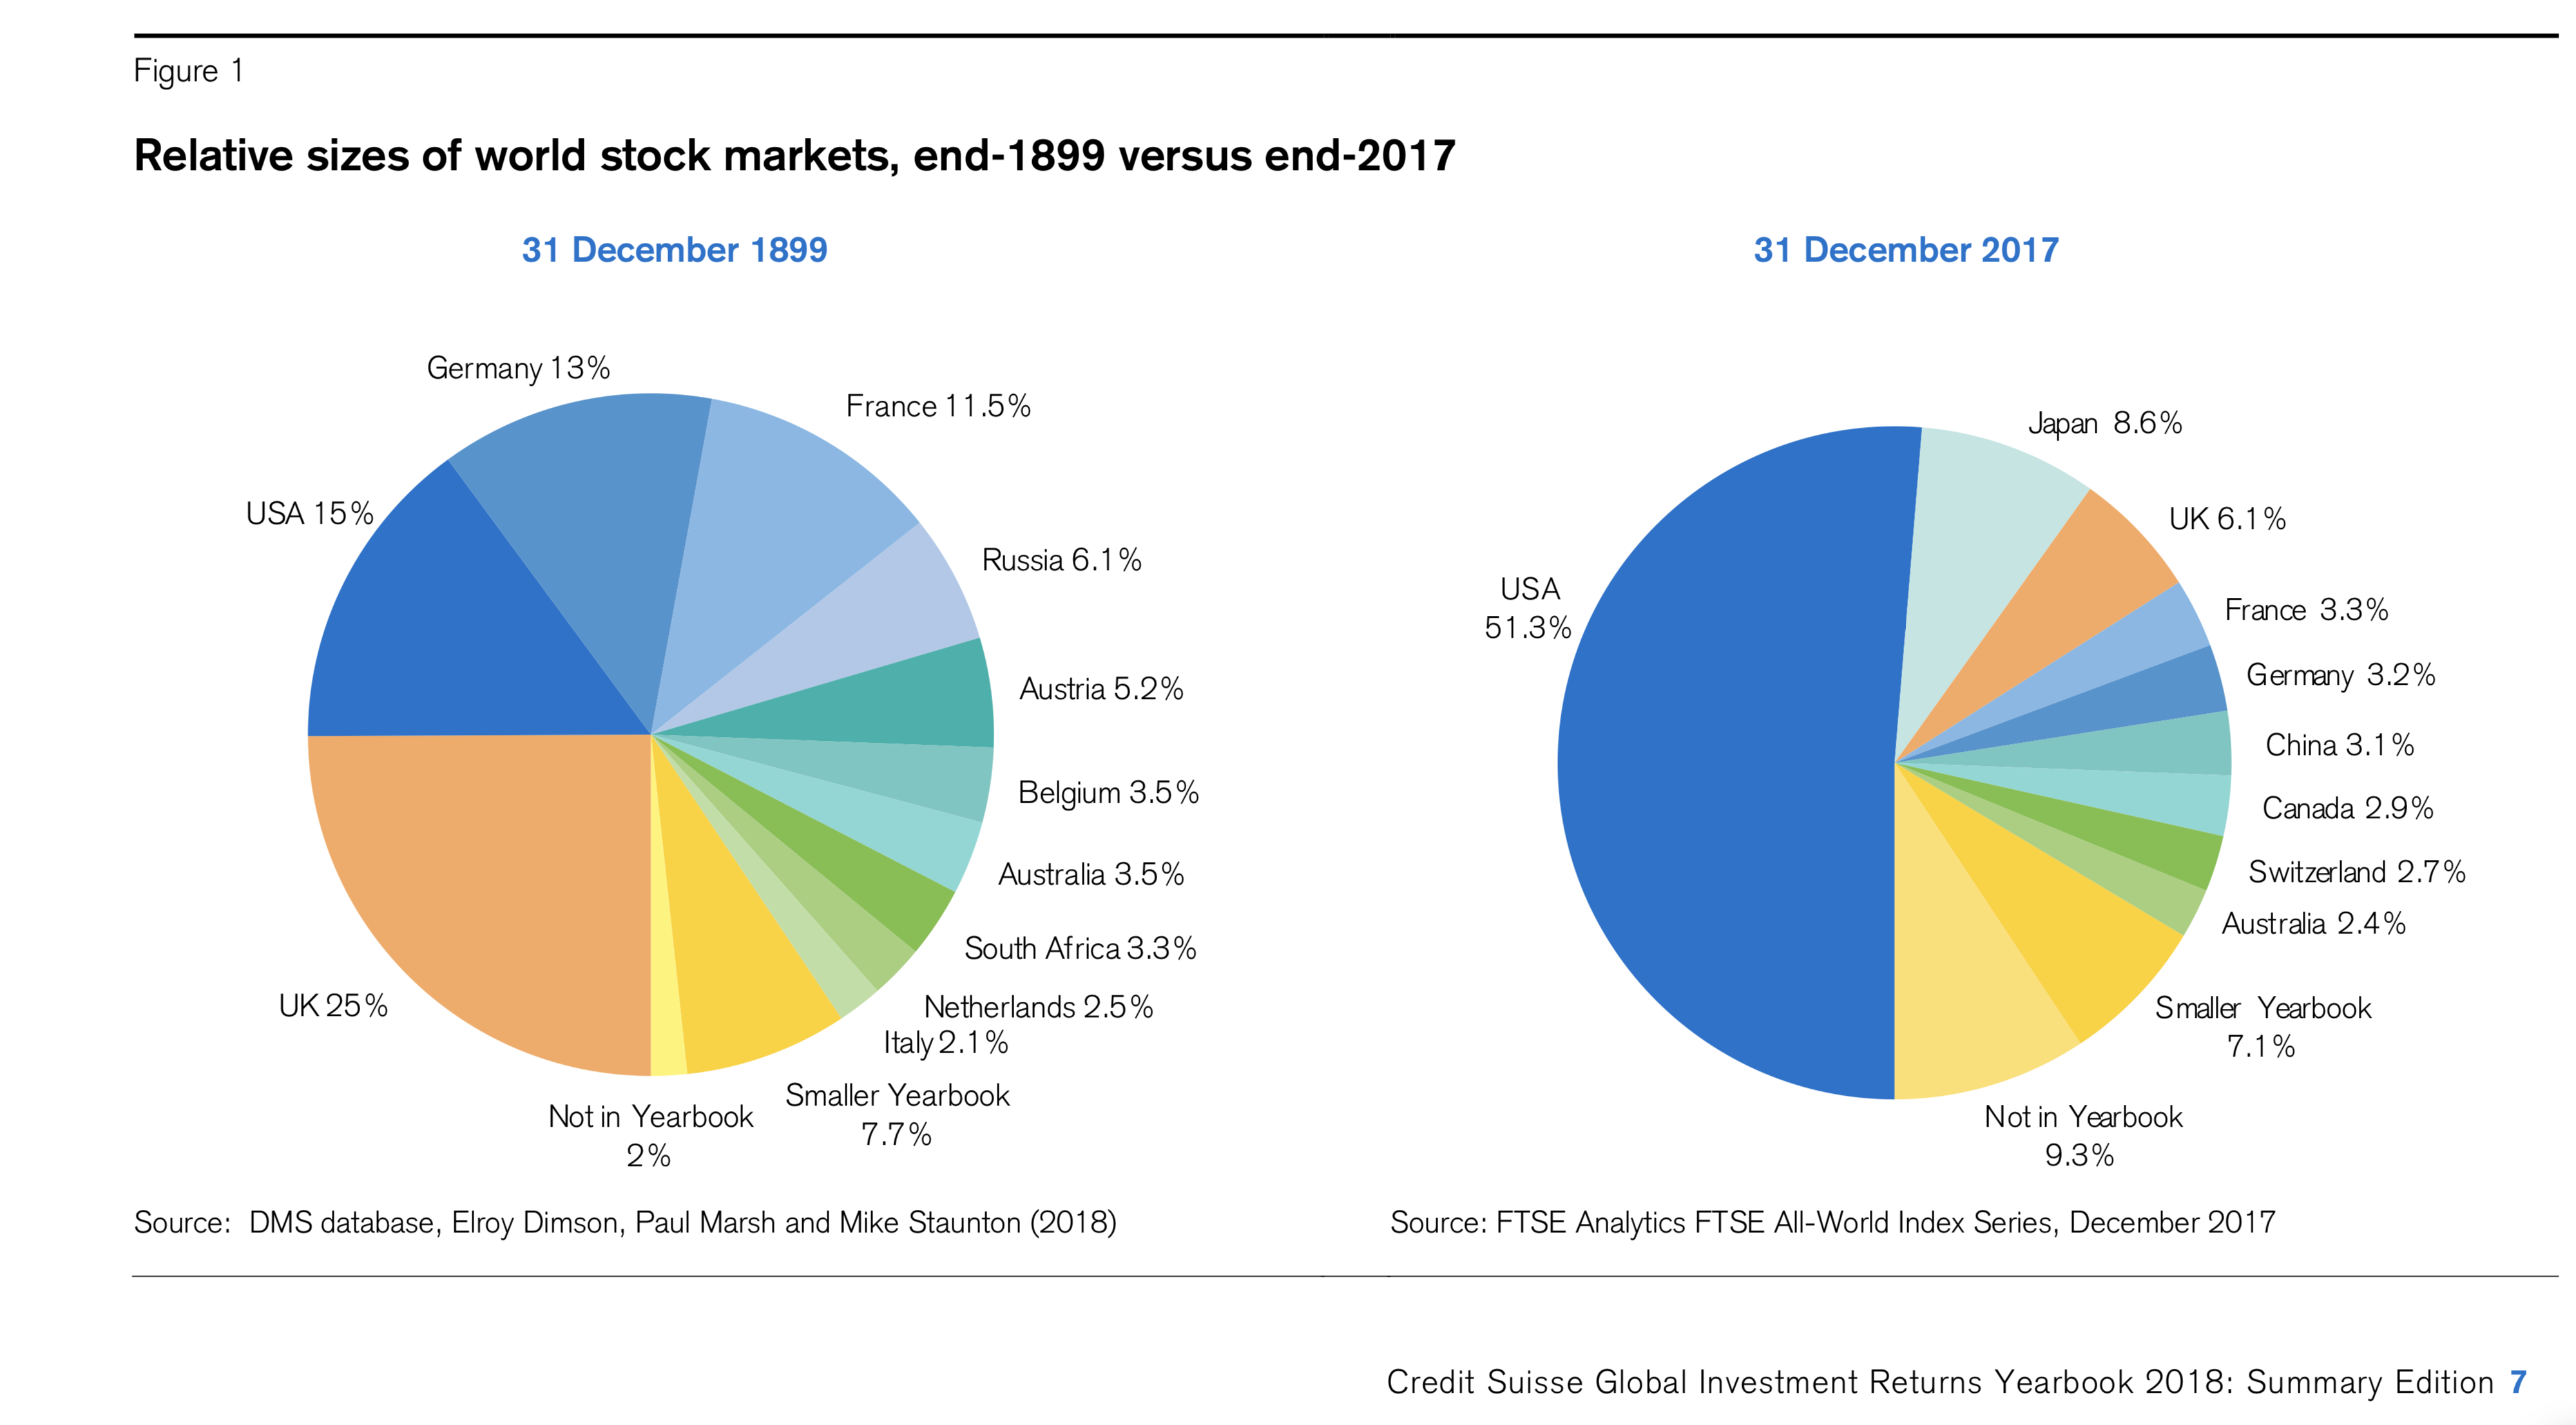
The countries comprise of the United States and Canada, ten countries from what is now the euro currency area (Austria, Belgium, Finland, France, Germany, Ireland, Italy, the Netherlands, Portugal and Spain), six non-euro zone markets in Europe (Denmark, Norway, Russia, Sweden, Switzerland and the UK), four Asia Pacific markets (Australia, China, Japan and New Zealand) and South Africa. Together, these countries make up 91 per cent of the investible universe for a global investor (based on free-float market capitalisations).
The graph below shows how the weightings of these countries have changed over the 118 years of analysis. The shift in the US weighting from 15.0 per cent to 51.3 per cent and the accompanying decline in the UK (25.0 per cent to 6.1 per cent), Germany (13.0 per cent to 3.2 per cent) and France (11.5 per cent to 3.3 per cent) is most notable.
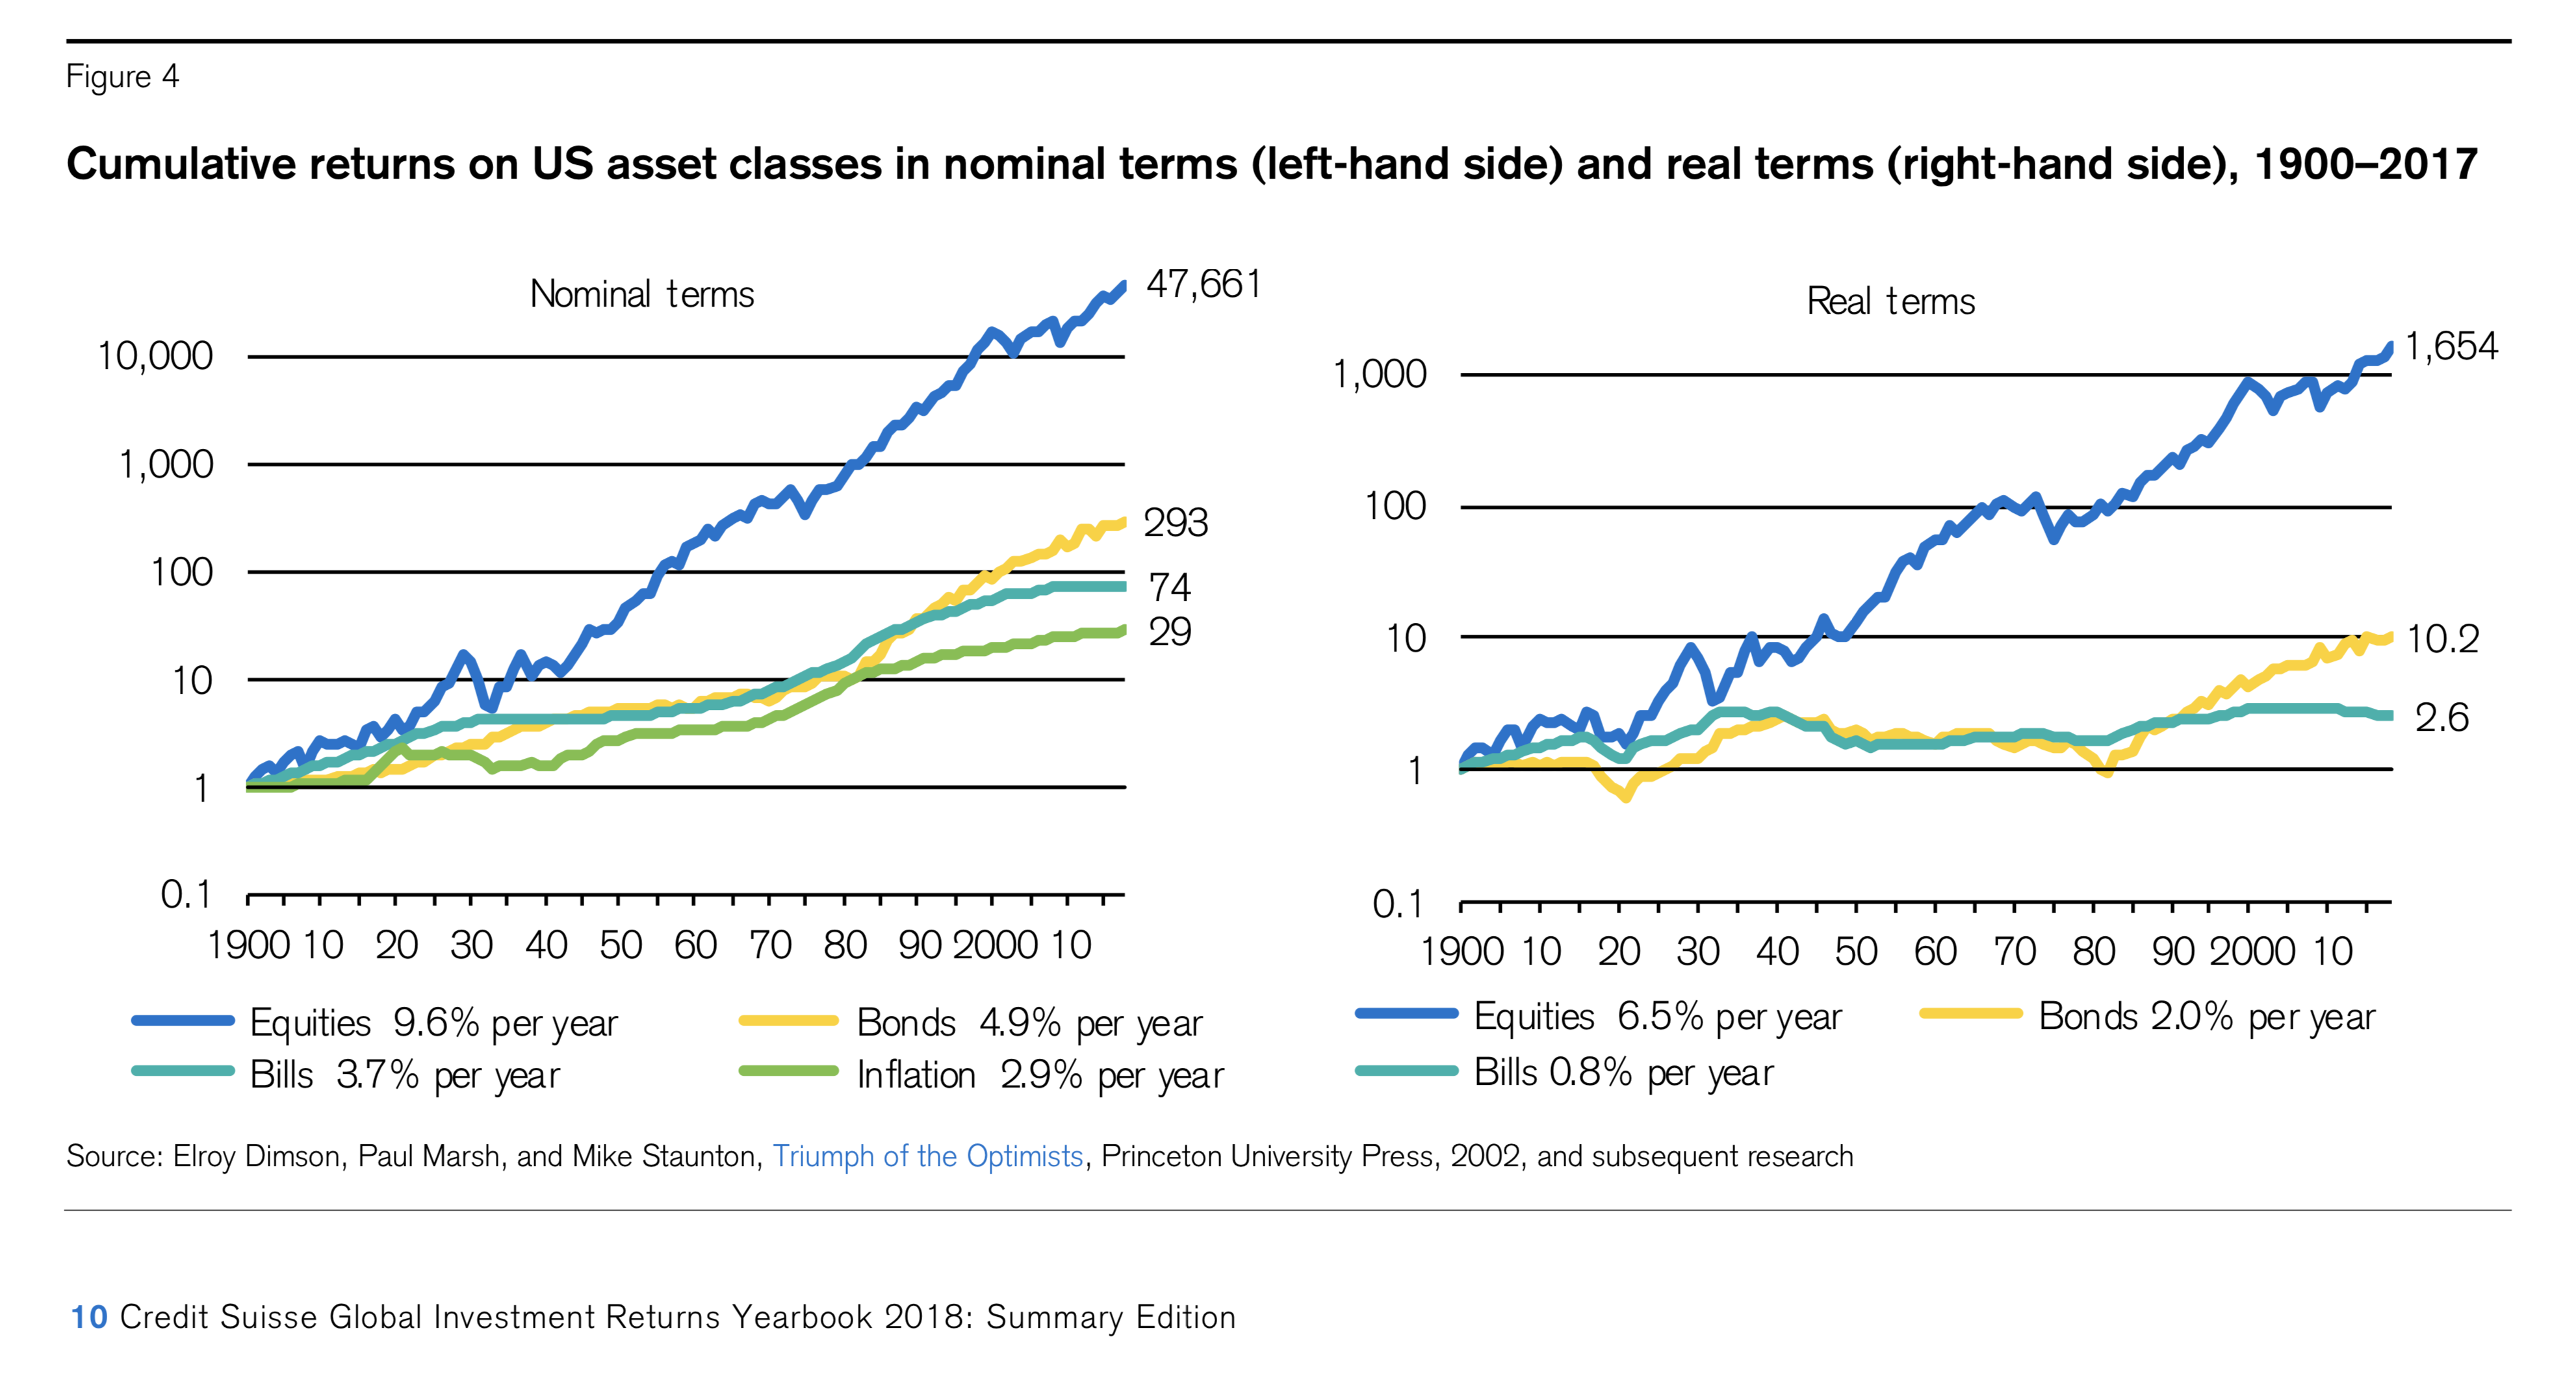
Detailing the nominal returns and real returns is probably the biggest takeaway. Over the 118 years, on average, equities have returned 9.6 per cent per year, bonds 4.9 per cent per year, bills 3.7 per cent per year and inflation 2.9 per cent per year. As seen from the left-hand graph below, $1 invested in equities turned into $47,661 in nominal terms, while $1 invested in bonds turned into $293.
The right-hand graph shows the real returns on US equities, bonds and bills and these come down to 6.5 per cent per year, 2.0 per cent per year and 0.8 per cent per year, respectively. Over 118 years, the original $1 invested in equities, together with dividends, turned into $1,654. With bonds, the $1 turned into $10.20. (Interestingly, only the two mineral based economies, Australia and South Africa, did better than the US in real returns on equities over the 118 years under review).
Inflation is the great deceiver, and Professor Jeremy Siegel from Wharton argues the average real return from equities has been surprisingly stable at around 6.5 per cent per year, and this has become known as Siegel’s Constant.
Before simply buying equities for the very long term, we probably should consider the following:
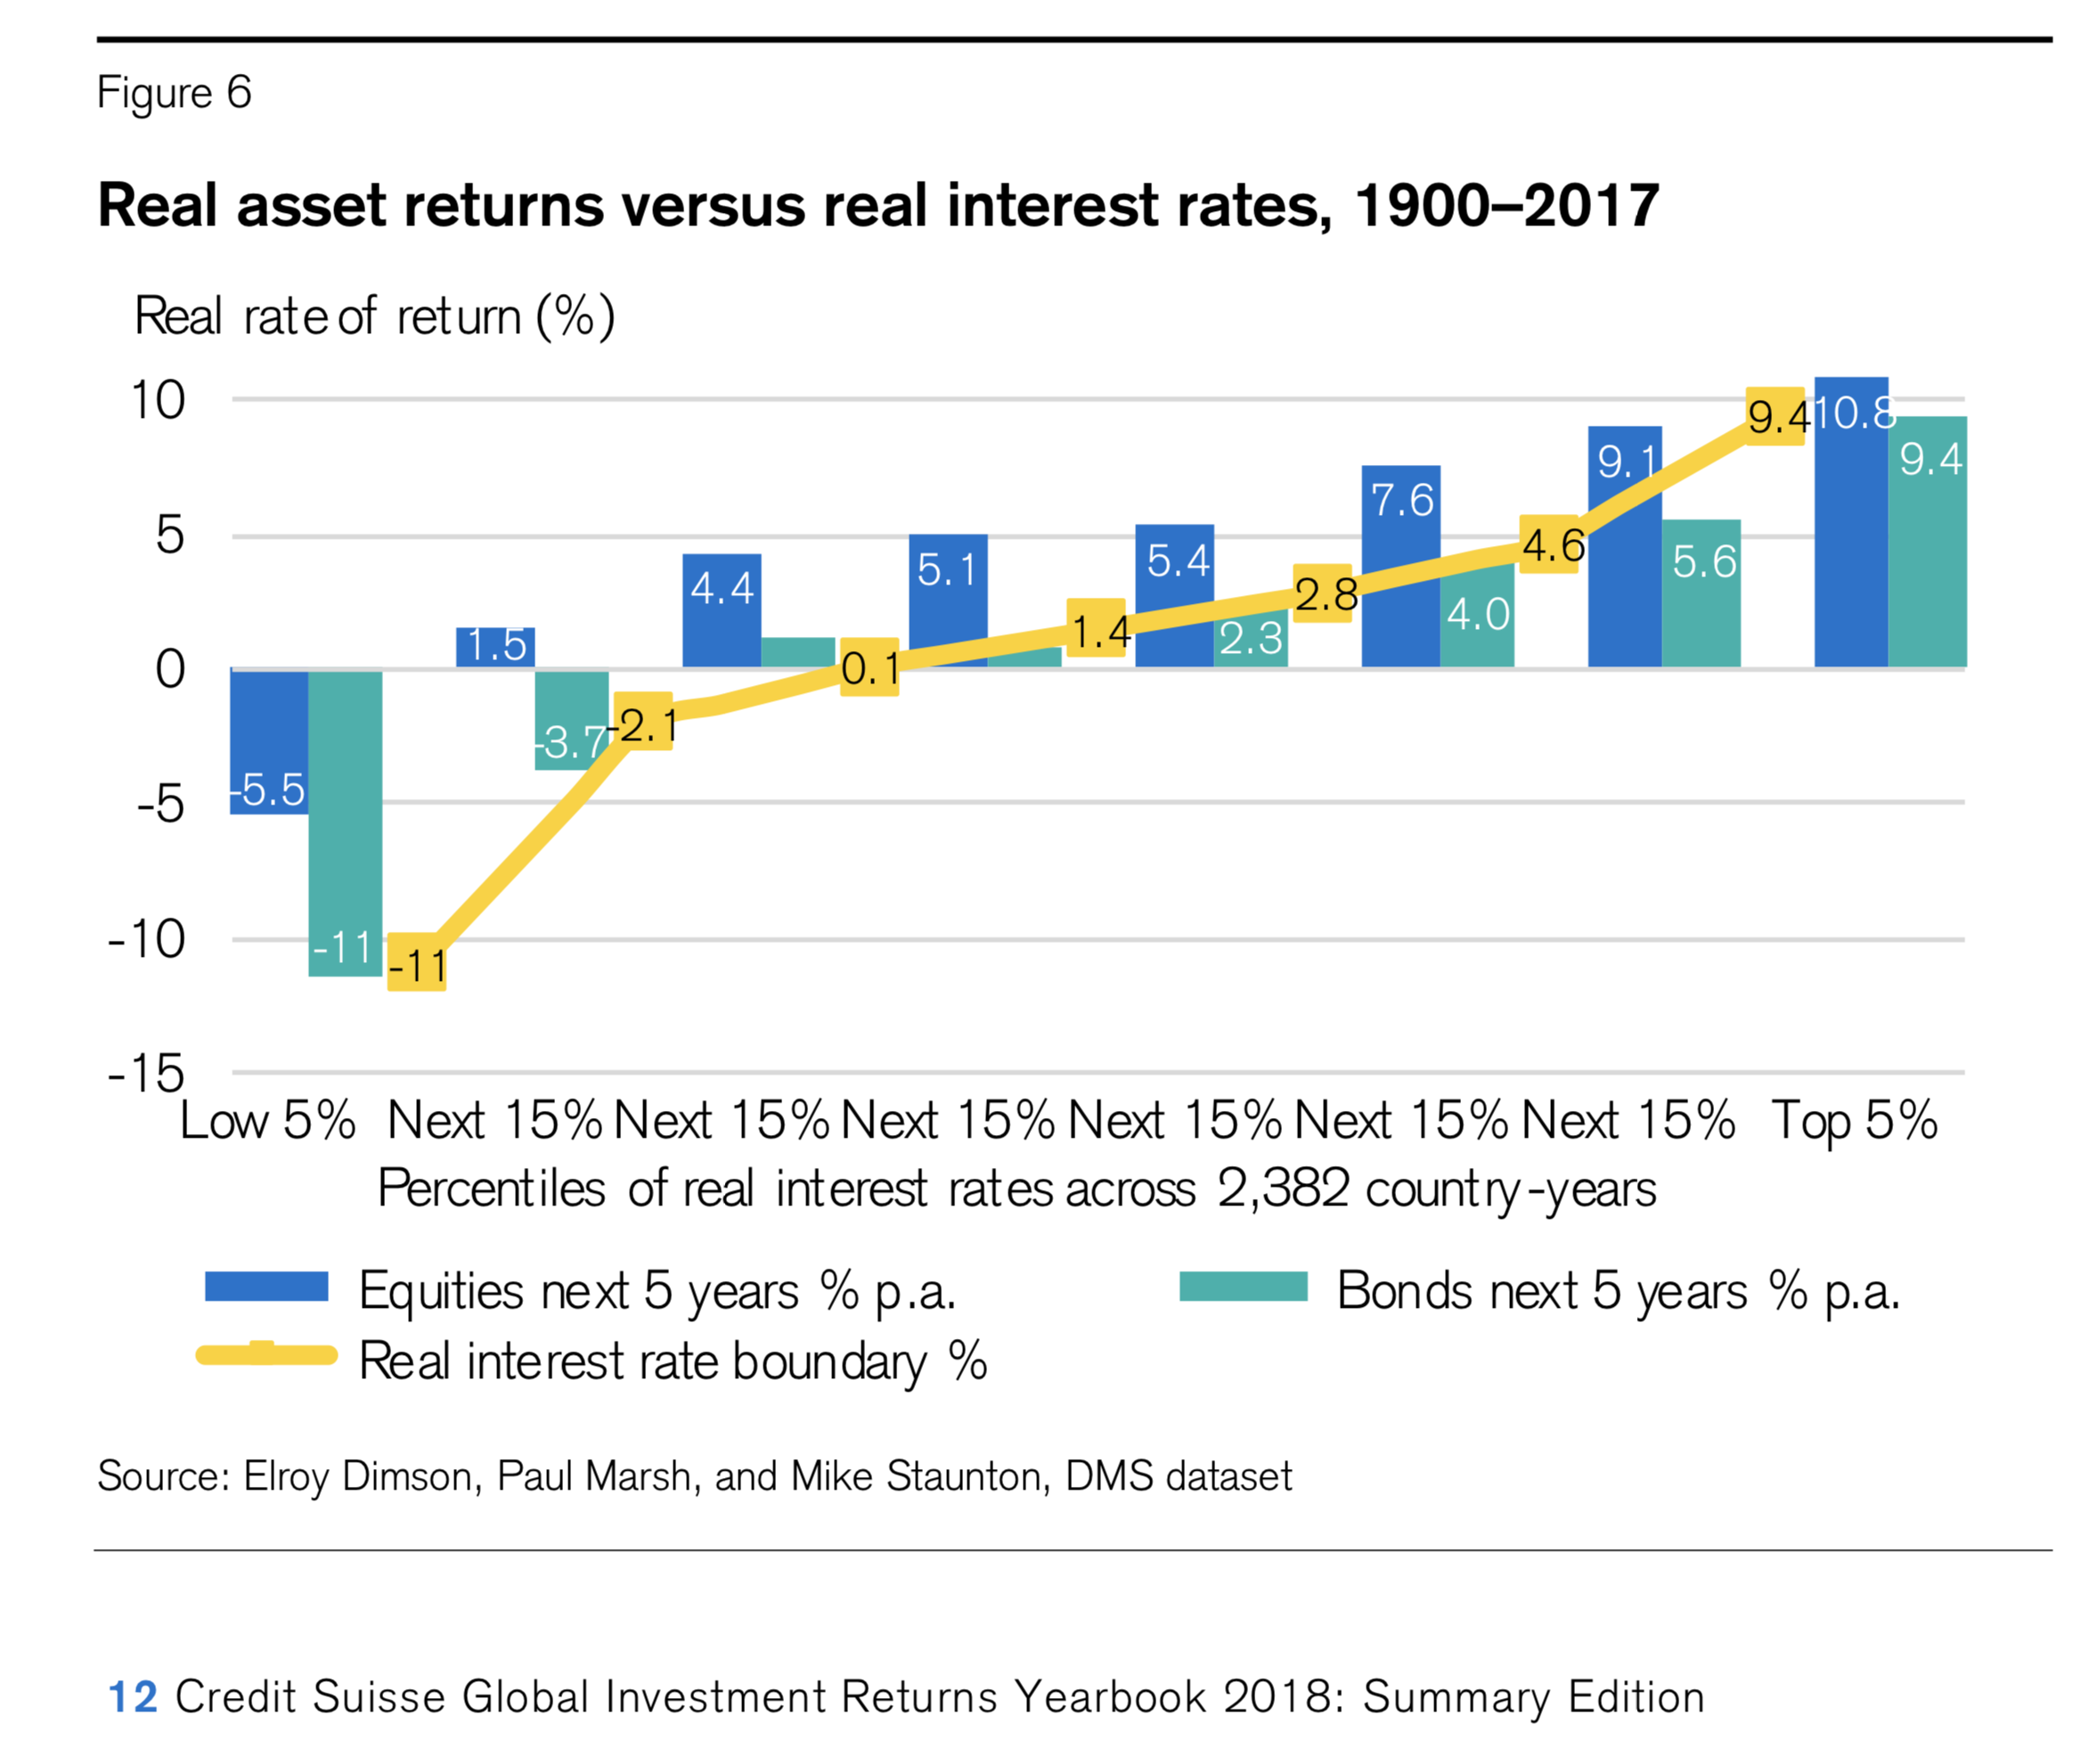
- The real interest rate on Treasury Bills represents the real return on a (near) risk-free asset. The expected return on equities needs to be higher than this to compensate for higher risk. For context, US equity markets delivered a negative return in 38 of 118 years, relative to treasury bills, or nearly one year in three; and
- The analysis by Dimson, Marsh and Staunton over 118 years (and from 2,382 observations of overlapping five-year periods), demonstrates the clear relationship between the current real interest rate and subsequent five year real returns for both equites and bonds. When real interest rates are low, expected future returns on all risky assets are also lower. We note that while today’s nominal short-term interest rates are at record lows, real rates are generally not in the extreme negative territory, as per the left-hand side of the graph below.
Chief Executive Officer of Montgomery Investment Management, David Buckland has over 40 years of industry experience.
David is a deeply knowledgeable and highly experienced financial services executive. Prior to joining Montgomery in 2012, David was CEO and Executive Director of Hunter Hall for 11 years, as well as a Director at JP Morgan in Sydney and London for eight years.
This post was contributed by a representative of Montgomery Investment Management Pty Limited (AFSL No. 354564). The principal purpose of this post is to provide factual information and not provide financial product advice. Additionally, the information provided is not intended to provide any recommendation or opinion about any financial product. Any commentary and statements of opinion however may contain general advice only that is prepared without taking into account your personal objectives, financial circumstances or needs. Because of this, before acting on any of the information provided, you should always consider its appropriateness in light of your personal objectives, financial circumstances and needs and should consider seeking independent advice from a financial advisor if necessary before making any decisions. This post specifically excludes personal advice.
I wonder what the actual returns would be after considering the need to pay personal income tax on the reinvested dividends & capital gains tax on rebalancing of the portfolio (which should be considered additional contributions
For all of your history buffs – there is a longer chart at the link below:
https://www.marketwatch.com/story/worried-about-todays-market-take-a-look-at-this-chart-2016-11-03
Also a good book to look at “the Wall Street Waltz” by Fisher.
Hi David
I decided to go back 15 years and work out the return of the All Ordinaries Index plus dividends , both on a nominal and real return basis.
GROWTH
– Index March 2003 – 2849 Points
– Index March 2018 – 5869 Points
= CAGR 4.94%
DIVIDENDS
– Average Dividend Yield over 15 years = 4.2% (Excluding Franking Credits)
INFLATION
– March 2003 to March 2018 = 2.49% PA
RETURNS
– Nominal Return 9.14% (Excluding Franking Credits)
– Real Return 6.65% (Excluding Franking Credits)
The real return is close to the long term of the US, but if you add in the value of franking credits of about 1.3% that brings the real return up to 7.95% – not bad when you think about it. Whether we can do the same in the next 15 remains to be seen.
Thanks Max, Siegel’s Constant generally gets a range of 6.5%-6.75% average annual real return on US equities over the very long term, so with your franking credits you must be pleased! The big dive in interest rates over recent decades has been a nice tailwind, and that will not repeat from the recent record lows.
long term averages are one thing but unfortunately we don’t all live for 117 years.
it greatly depends on which decades you invest in as to what returns you get.
average returns over a 117 year period can be totally different to what you get from decade to decade.
thus it pays to be much more active than just set and forget and expect to get 9.6% per annum.
sorry for stating the obvious which I’m sure we already know.
Thank you Carlos. Yes, stock market returns are risky in the short-term. Annual returns typically range from negative 22 per cent to positive 36 per cent, nine years out of ten, and year ten can be either much better or much worse. (And typically the bad years are often consecutive). Indeed one year in three is negative in real terms and even the US went for 16 years from 1905 to 1920, where its share market cumulatively under-performed Treasury Bills. Surprising to some, the volatility of equities returns comes down over the longer-term.