Market PE ratios
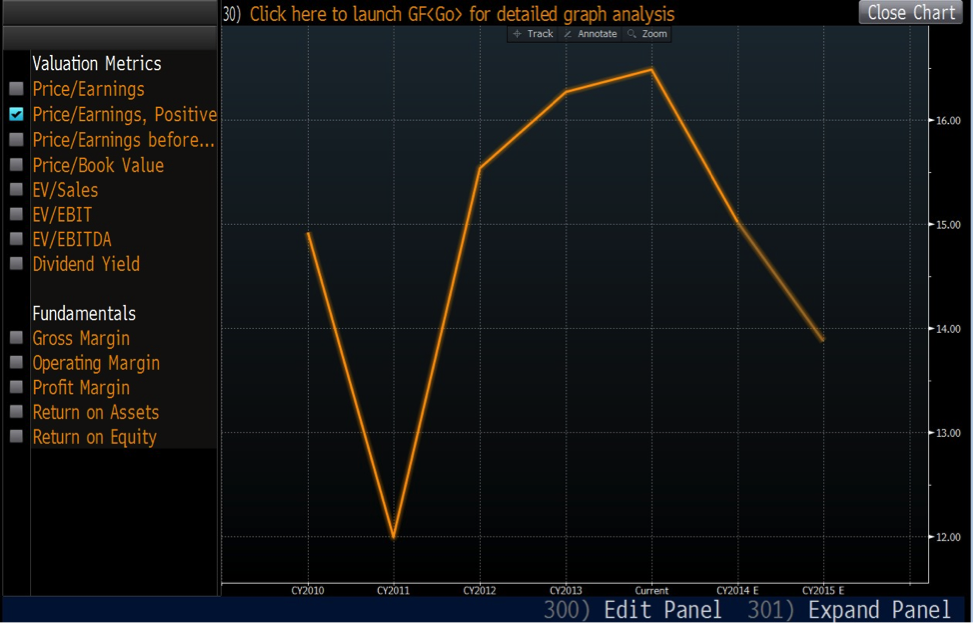
The one-year forward price-to-earnings (P/E) ratio for the S&P/ASX 200 index has varied significantly over the past few years. In 2011 it fell to 12 times, and recently market participants have been sufficiently enamoured to push the ratio as high as 16-17 times.
At present, Bloomberg estimates the forward P/E ratio of the ASX 200 to be 15 times 2014 earnings. This level is within the range recorded over the past few years, and also in the 14-15 times P/E ranges that the Australian share market has traded on average since 1970.
Despite this apparently modest reflection of relative enthusiasm, we have recently read many articles suggesting ‘bubble’-like conditions currently exist. So what should you make of it?
The Australian share market as represented by the ASX 200 index at any time represents the “price” of the market as a whole. In a perfect world it should also represent the present value of future earnings estimated by the market as a whole. From the information provided, we should be able to solve for the expected earnings of the index, by simply taking the current ASX 200 index price and dividing it by the P/E.
Now, the value of a share of a company is simply the sum of future cash flows (we assume the earnings are a proxy for this) discounted back to today. The value of any index is also simply the sum of the future cash flows of each of the constituent companies discounted back to today. Using this estimated earnings number, and the discounted cash flow formula, we can quickly estimate the assumptions for future growth the market is implying at its current level, explaining why the market trades on an earnings multiple of X and examine whether or not this is rational using history as our guide.
By dividing the current index level of ~5,500 by a P/E of 15, we obtain earnings of the entire market of ~$366.6, upon which we can apply the discounted cash flow (DCF) formula, rearranged to solve for the growth rate the market is assuming.
Using the Gordan growth model as our base, we can simply discount the market’s estimated earnings of $366.6 by the average cost of equity (COE). We will use 10% as the COE, as this is the historical average. We then solve for the growth rate (g).
Expressed algebraically, the market’s growth expectations are estimated thus: 5,500=366.6/(10%–g).
Since 1970, Australian economic growth has averaged 3-3.5 per cent per annum. Over the long-term, we would also expect earnings for the businesses that make up the ASX 200 index to approximate GDP growth on average over the long-term – provided failed and delisted companies are taken into account. Survivor bias of course ensures the reported earnings growth rate of the ASX indices looks far more favourable.
If we factor in a 3 % growth rate into our formula, we obtain an index valuation of 5,237. At 3.5% we obtain an index valuation of 5,640. At the present ASX 200 index valuation level of 5,500, the long-term growth rate being implied by the market lies somewhere in between 3 per cent and 3.5 per cent.
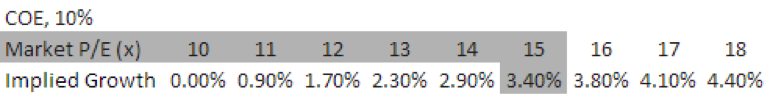
Therefore on a current 1 year forward P/E of 15, and adopting a 10 per cent COE, the market is implying a long-term growth rate in earnings of ~3.4 per cent which is precisely where we are today.
You might believe given the dominance of the large banks and miners in the index, that the market cap weighted COE could be lower. If so, it suggests the implied growth rate of the market at today’s level is lower again. In other words, the market might not be expensive at all and certainly is not in a bubble.
At various market P/E levels (assuming a COE of 10%), we also can back-solve the growth rates. At a P/E of 12, for example, the market is implying a longer-term growth of 1.7%. This is well below Australia’s long-term trend and whilst a period of subdued growth is typical in any market cycle, history shows that by taking a long-term view, even the worst economic disasters prove to be temporary in nature.
If we were to assume the P/E of the market as a whole was 10, earnings would simply be capitalised at 10% = 366.6/ (10% – 0%) = 3,666 as a fair valuation for the index. This effectively means that there is no future growth priced in the market at that point. This is, however an unrealistic long-tem assumption and really only likely to occur under extreme short-term circumstances such as the GFC when the economic outlook is extremely confusing. Zero growth, however, is not an assumption the market hangs onto for long, and inevitably after every crash, more rational expectations return. We can therefore consider 3,667 as a base level of support for the market and any time the market heads below this level (assuming interest rates are approximately where they are today) is cheap.
One take-away from this simple expression of the market is that you should be careful with your equity exposure when the market begins implying growth in excess of that of what has been achieved in the past on a long-run basis. For it is then that the bubble-like pricing may exist. That, however, does not appear to be the current picture.
We do not appear to be experiencing bubble-like conditions. At current ASX 200 index pricing levels, the market merely appears to be expecting the Australian economy to grow around historical trends for the foreseeable future. And, even if interest rates were to rise modestly, there is still room for the market to produce gains in the short run.
Finally, keep in mind that any attempt to value the market is not a prediction of its near-term direction.
This post was contributed by a representative of Montgomery Investment Management Pty Limited (AFSL No. 354564). The principal purpose of this post is to provide factual information and not provide financial product advice. Additionally, the information provided is not intended to provide any recommendation or opinion about any financial product. Any commentary and statements of opinion however may contain general advice only that is prepared without taking into account your personal objectives, financial circumstances or needs. Because of this, before acting on any of the information provided, you should always consider its appropriateness in light of your personal objectives, financial circumstances and needs and should consider seeking independent advice from a financial advisor if necessary before making any decisions. This post specifically excludes personal advice.
INVEST WITH MONTGOMERY
Mike B
:
I’m of the view market P/E ratios are really a redundant/useless metric to use in any investment process. As Roger so often points out, ‘price’ does not always reflect ‘value’.
There is much discussion above on what WACC to use, however I’m of the view the calc is flawed well before this. This is because the blog post assumes an unrealistic perfect situation where price = value, therefore allowing calculation of the index earnings, NPV, growth rate and subsequent inference on whether the market is in a bubble or not. However, I think Roger alludes to this at the start when he says: “In a perfect world it [the price of the ASX 200 index] should also represent the present value of future earnings estimated by the market as a whole”. Surely then the conclusion that the market is not in a bubble could not be taken with much confidence?
I look at the price of shares or indices as a poorly correlated objective measure of sentiment. Therefore, for the most recent earnings metric reported, the P/E ratio can really only tell an investor how the market ‘feels’ about the stock/index compared to other competitors or the broader sector. To look at the P/E ratio in isolation or comparatively and infer a stock is relatively cheap or expensive seems, in my opinion, presumptuous and not correct. Likewise, using the P/E ratio to calculate a growth rate seems just as dubious.
I’d love to get Roger’s view on this.
Andrew Edwards
:
Hi Russell – I totally agree with you, I think its much more prudent working with 10% WACC…
However you do have to wonder if that is precisely what is happening with market valuations particularly in the US as the cost of money, debt and captial is at generational lows.
With a major demographic decline unfolding and dis-inflation in Europe etc. it is quite possible and possibly even totally realistic that average cost of capital could fall and stay far lower than 10% for years even decades.
Still, you are 100% right no argument there, I just wondered if you had tried modelling it.
Aditya Asawa
:
Interesting analysis. I have two questions which have perplexed me for some time when using the Gordon Growth Model:
1. Is GDP growth the right comparator to use for the perpetual growth rate in the model? GDP growth to me approximates overall corporate revenue growth, whereas most profitable corporates grow underlying profits at higher than GDP growth due to the impact of leverage (both operational and financial). So, for example, is it right to use 2-3% as a perpetual growth rate for say CSL or SEK when trying to value the terminal value using the Gordon Growth Model in a 2 stage DCF?
2. You have used a cost of equity of 10% in your analysis. I have no issue with this whatsoever, but the question I have is whether the cost of equity should move with changes in underlying interest rates. I would have thought that in periods of systemically low interest rates, one would assume the market P/E would increase (as we are seeing now). This in fact is what is implied by CAPM – that the market P/E should be directly correlated to the risk free rate of return. This is part of the reason why, I believe, the market can trade at higher P/Es than historical averages due to lower risk free rates which look to be staying where they are for some time.
Russell Muldoon
:
We think its a valid proxy. Some sectors will do better, some worse over any 10 year period, but on average, 3-5% has shown over the past 40-50 years to be about right.
Given all of the risks of investing in a business we wouldn’t consider lowering our discount rates on future cash flows to less than 10%. But we are not the market and over shorter periods of time, there have been many examples of periods where excessive risk taking has prevailed.
Andrew Edwards
:
PS – I know the true WACC across the ASX is not 5% (perhaps in the US) but perhaps somewhere in between 5-10% and perhaps also falling
So being a bit cheeky there…
But what do think about modifying the WACC or Risk Free Rate of Return to come up with different outcomes??
Russell Muldoon
:
Of course you can, but I would not lower COE below a 10% hurdle. Its unrealistic in the longer-term.
Andrew Edwards
:
Nice article,
But with the WACC of around 5% (as is possibly currently the case) and what valuation would you come up with?
Financial Repression has all sorts on unintended consequences huh?
Russell Muldoon
:
Hi Andrew, I wouldn’t even attempt to do that.