
Why our soaring market still looks ok to me
Are share markets cheap or expensive right now? Well, it depends who you ask. And there are plenty of people happy to offer their opinion. But at the risk of adding to this largely irrelevant discussion (after all, we buy shares in companies, not ‘the market’) here’s my take. Please feel free to comment – I’d love to read your views as well.
The pandemic remains out of control in the northern hemisphere and Sweden’s attempt at herd immunity has failed. Despite this, equity markets have recorded their best month in three decades. Notwithstanding a seemingly out of control global pandemic, an unresolved presidential election, and some signs of a loss of momentum in the economy, equity prices in November soared to all-time highs yet again.
The November market gains, however, were not led by the FAANGS or FAAMGS. It was small companies that surged 16 per cent, outstripping the Dow and S&P 500. (You can find out more about our investments in small companies, via the Montgomery Small Companies Fund here.)
As we have noted previously, the market may remain elevated while the leadership of the market changes from high priced, long-duration (profitless) companies to more boring, annuity income-driven, reopening and dare we suggest ‘value’ stocks.
Here are some of the arguments for and against an expensive market. I’ll leave it for you to decide.
Robert Shiller’s CAPE Ratio
The Shiller CAPE ratio (CAPE stands for cyclically adjusted price-to-earnings) is a PE ratio based on average inflation-adjusted earnings from the previous 10 years. As at 3:11 PM EST, Mon Nov 30 the Shiller S&P500 PE Ratio stood at 33.04 times cyclically adjusted earnings. This places it at the second highest level it has been since 1870 and well above its average of 16.76 times earnings. The ratio has only been higher during the DotCom bubble of 1999 and early 2000.
Figure 1. Shiller CAPE Ratio as at November 30, 2020

While many observers suggest the extreme level indicates risk of a market crash, Robert Shiller himself explained the ratio is not a robust predictor of market disruptions. Instead, he proffered, it was a reliable indicator of the average return for the next ten years. The higher the ratio, the lower the implied future return. Indeed, when the ratio is above 20 times earnings, the market has generated average returns that are lower than when the ratio is below 20. Also, when the ratio is below 20, double-digit returns, over the course of the ensuing decade, are more frequent than when the ratio is above 20.
The current extreme level relative to history suggests the average annual return an investor will receive from investing in the S&P500 index today will be in the lower single digits over the next decade.
This of course is not a concern to investors who focus on individual and rationally priced high-quality companies with bright prospects.
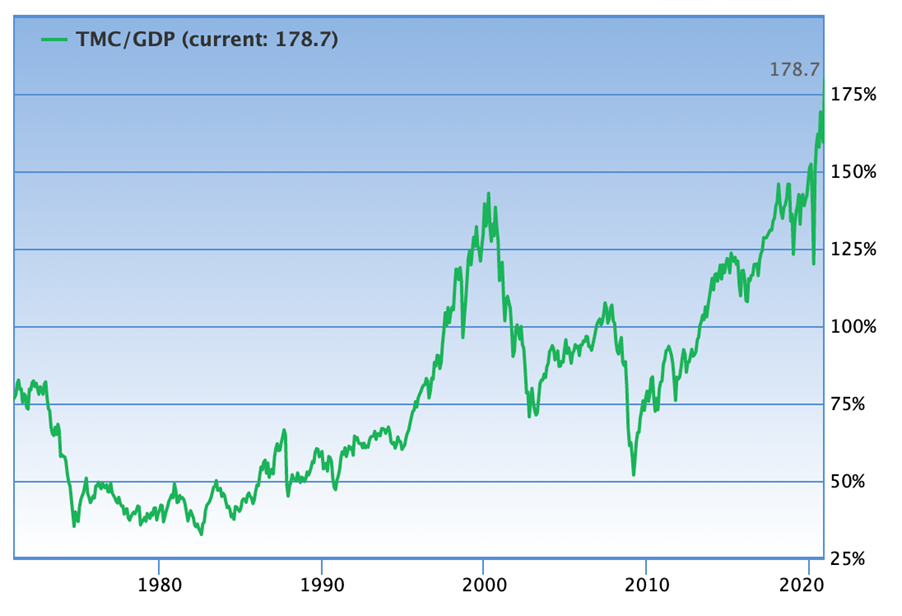
Buffett’s Market Cap to GDP ratio
Another ratio investors may employ to reinforce the argument that the market is expensive is Warren Buffett’s Market Capitalisation to GDP ratio. This ratio compares the total market capitalisation of the US stock market to the annual output of the US economy.
Figure 2. Ratio of Total Market Cap to US GDP
The ratio’s popularity stems from a handful of rare market calls Buffett has made while referring to the ratio. In November 1999 – just a few months before the DotCom crash, Warren Buffett presented at the Allen & Company Sun Valley conference, to a bunch of tech entrepreneurs and their backers, Bill Gates, and a phalanx of old-world media moguls, billionaires and Hollywood producers.
This was Warren Buffett’s first slide:
Dow Jones
Industrial Average
December 31, 1964 874.12
December 31, 1981 875.00
He noted that during the 17 years highlighted, the size of the economy grew fivefold and the sales of the Fortune 500 companies grew more than fivefold, yet the stock market went nowhere. He contrasted that period to the 1990s “baloney” bull market (the Dow Jones index was at 11,000 and had risen an average 13 per cent per year for the prior 18 years). Profits had grown much less than in the previous period and yet stocks were expensive because interest rates were low.
Buffett then revealed the Market Cap-to-GDP slide noting that, for several years, the market’s growth had been outstripping the rate of growth of the economy. Buffett suggested the next 17 years’ market performance may look no better than the period from 1964 to 1981. “If I had to pick the most probable return over that period, it would probably be six per cent.”
Two years later, after the Dow had fallen to 9,000, Warren Buffett said, “I would expect now to see long-term returns run somewhat higher, in the neighbourhood of seven per cent after costs.”
Finally, Warren Buffett wrote in October 2008 just before the bottom of the Global Financial Crisis: “Equities will almost certainly outperform cash over the next decade, probably by a substantial degree.”
The ratio today is at an extreme level of 178.7 per cent, indicating a substantially overvalued market. You will note that the ratio has been extreme for some time and yet the market continues higher. Nevertheless, the ratio reinforces the message offered by the Shiller CAPE Ratio: that low future returns are implied.
A bullish argument – or a less bearish one
At the Sun Valley Conference in 1999 Buffett also discussed interest rates, noting, “What you’re doing when you invest is deferring consumption and laying money out now to get more money back at a later time. And there are really only two questions. One is how much you’re going to get back, and the other is when.
“Now, Aesop was not much of a finance major, because he said something like, ‘A bird in the hand is worth two in the bush.’ But he doesn’t say when. Interest rates – the cost of borrowing – are the price of ‘when’. They are to finance as gravity is to physics. As interest rates vary, the value of all financial assets – houses, stocks, bonds – changes, as if the price of birds had fluctuated. And that’s why sometimes a bird in the hand is better than two birds in the bush and sometimes two in the bush are better than one in the hand.”
Referring to the 1990s bull market, Buffett noted birds in the bush were expensive because interest rates were low. In other words, nobody wanted the bird in the hand (cash), so they had gradually migrated towards more attractive relative returns.
After declining for 38 years, interest rates today are lower than they have ever been. Consequently, the gravitational force on asset prices has been very light and asset prices have risen.
Whether or not the market is expensive however can be determined by comparing the stock market’s earnings yield to the yield available on bonds, after adjusting for the risk of being in equities.
Australian 10-year bonds currently yield just 0.955 per cent. The equity market risk premium is estimated at about 3.5 per cent. Adding these two together, we arrive at an implied ‘fair value’ earnings yield of 4.45 per cent. The earnings yield is the inverse of the price earnings ratio, so by dividing 4.45 per cent into 100 we arrive at an estimated fair value PE of 22.4 times earnings.
The S&P/ASX 200 one year forward PE is 18.7 times as at 1 December 2020 and the PE for ASX200 companies with positive earnings is 23 times. Comparing the current ratios with that implied by bonds adjusted for risk, and given interest rates are not expected to rise until inflation is sustainably in the target inflation band, the market appears to be fair value or even slightly cheap.
Roger Montgomery is the Founder and Chairman of Montgomery Investment Management. Roger has over three decades of experience in funds management and related activities, including equities analysis, equity and derivatives strategy, trading and stockbroking. Prior to establishing Montgomery, Roger held positions at Ord Minnett Jardine Fleming, BT (Australia) Limited and Merrill Lynch.
He is also author of best-selling investment guide-book for the stock market, Value.able – how to value the best stocks and buy them for less than they are worth.
Roger appears regularly on television and radio, and in the press, including ABC radio and TV, The Australian and Ausbiz. View upcoming media appearances.
This post was contributed by a representative of Montgomery Investment Management Pty Limited (AFSL No. 354564). The principal purpose of this post is to provide factual information and not provide financial product advice. Additionally, the information provided is not intended to provide any recommendation or opinion about any financial product. Any commentary and statements of opinion however may contain general advice only that is prepared without taking into account your personal objectives, financial circumstances or needs. Because of this, before acting on any of the information provided, you should always consider its appropriateness in light of your personal objectives, financial circumstances and needs and should consider seeking independent advice from a financial advisor if necessary before making any decisions. This post specifically excludes personal advice.
Hi Roger,
Great article! A lot of the US companies operate in global markets, would it be a fair assumption to include other relevant countries GDP to the mix?
GNP may actually be the solution Alexandros.
If one looks 5to 10 years,I feel one needs to allow for the large country debts of Western countries,Aust,UK,USA.In addition with negative interest rates accelerating,the usefulness of the foreign part of the US dollar seems at risk of being far less relevant. A new order for international transactions seems to be another risk, not being taken into account.
That sounds interesting John and something we need to be on the look out for. If (when) that narrative starts to shift, be ready.
It seems the market expects the ultra low interest rate will last as far as eye can see (next 10 – 20 years). Government organisations (central banks) tend to be reactive in nature and are poor in predicting black swan events (they may have hundreds of PhD researchers). I suspect a future crisis will force the change on interest rates. I don’t know when and what. It is painful to keep cash but more painful to lose money. Buffett said ‘be fearful when others are greedy’. I am a little fearful at the moment.
Thanks Alan.
Thinking a bit further ahead, which may tie in with the answer of whether markets are currently cheap or expensive.
The Federal Reserve has stated that they intend to target higher than average inflation – an apparent proactive attempt to mean revert a prolonged period of subpar inflation.
The RBA appears to have been bold enough to say that they won’t raise rates for three years and, even in the face of a strongly rebounding economy with vaccines on the way, are telling first home buyers that now is the time to buy. They’ve stated that the previous perception that central banks will jump on any inkling of inflation may have contributed to past subpar inflation and they seem quite keen to shake off this perception.
Indeed, strong inflation appears to be a viable way to devalue the otherwise mountainous amounts of relative debt that we now see. A sensible but prolonged period of austerity and subpar earnings growth for the next generation appears to be far too old fashioned a solution.
So, with the newfound common place tool of quantitative easing, there could be a combination of low interest rates (low fixed interest rates that is, to ensure certainty) and high inflation. Even Australia’s sacred cow, residential property, could maintain its lofty prices if its current foundation of household debt remained cheap to maintain and subsequently devalued.
Of course, the losers are yet again the simple savers without income producing assets.
So, could the equities that are cheap be those that can pass on inflation or that are poised to capture that animal spirit demand that underlies an apparently desired source of inflation? Which equities would these be?
Or is inflation simply going to remain missing in action? Is low inflation the new norm?
Put another way, inflation has been so low for so long that I find it hard to recall what does ok in an environment of increasing inflation.
Nevertheless, could this suggest that lower interest rates for even longer make some equities currently even cheaper?
In the high inflation years of the 1970s, nothing did well Kenneth. Since then of course there have been many commentators who have suggested property does well in inflationary environments. if accompanied by steeply rising rates, I find that hard to compute.
With vaccines hitting the market now, earnings for the top companies are being reassessed back to normal levels. Using a discount rate of 7.5% and an earnings recovery with a low terminal growth rate, US and Australian stocks look fair to undervalued. Low interest rates are the key. If rates were to rise, this would cause a massive drop in stocks. However, it appears inflation is in check and low bond rates are the norm for the immediate future as the developed world is totally built out (with no growth) and the growth is coming from the new digital economy, not massive construction of property, infrastructure and industry. With the new digital economic growth comes low inflation, low interest rates and high asset prices. This situation is here to stay for the foreseeable future. Get used to high equity and property prices.
Thanks for sharing Victor.
Whilst overall I agree with the points above, the thinking holds an assumption we never touch, that may need dusting off when taking views over time periods this article suggests.
Re the shape of capitalism yesterday v tomorrow.
Yes $1 of cash is worth more to an investor today, but will it always reach the investor? Is there a new equation arising within companies of significance (those who move the market) regarding stakeholder v shareholder.
– Does Amazon care more about going from $1.6T to $1.7T or taking millions of Americans out of poverty?
– Does Google care about another handful of billion, or reducing deaths/emissions in one blunt sweep (driverless cars)?
– Does the business case template in these organisations feature a DCF anymore, or is it simply make a difference in the world? Yes = go.
Government use to handle these things, hence within a company doing the right thing was pleasing shareholders. Now Governments cannot do these things, and companies can. In assuming shareholder growth continues at high rates for a long time, are you betting against companies doing the right thing?
Companies Vision statements use to be a near a template of “shareholder value”, just change the company name. Today’s they read very different.
Are the FAANG’s the super safe $ investments we think they are?
Interesting Mark. ANd ESG is definitely moving mainstream. I wonder however to what extent the FAAMG’s ability to engage in broader social good is adversely impacted by the anti trust narrative gaining traction in Congress.
Hi Roger
Most investors understand that falling interest rates have lead to a PE expansion and have played a big part in where valuations are today.
Your comments that “The equity market risk premium is estimated at about 3.5 per cent” has me a little confused. What justification is there today for an EMRP of 3.5% when historically it has been much higher? Why would a rational investor lower their expectations and accept 3.5% for taking on the market risk that exists today , when in the past a higher EMRP was achieved and likely with lower Market risk? Who has determined that an EMRP of 3.5% is justified in today’s Market?
Hey Max, I presented the market-accepted EMRP. By the way if you used something historically acceptable (say, from 15 years ago) you’d be 100% cash today. Is it reasonable to believe a high quality listed company cannot generate better returns over the next decade than cash?
Buffet’s first slide and commentary would suggest perhaps not? Don’t want to be a party pooper but when you’ve got the US Feds expanding money supply by 55% since February it’s difficult to apply any of the historic valuation methodologies with a straight face.
Indeed Jimbo. Simple and elegant analysis.