
What is next for small caps?
The past year posed considerable challenges for equity investors, including runaway inflation, a rising interest rate environment, geopolitical tensions, and the lingering effects of the pandemic. The confluence of these headwinds – and a lack of positive catalysts – roiled market sentiment, resulting in most equity analysts adjusting their expectations for corporate earnings growth substantially lower.
Though many of last year’s issues remain unresolved, we believe there are reasons for investors to be optimistic in 2023. Despite the uncertain economic outlook, we see silver linings in the small cap universe, particularly in many higher-quality businesses that have displayed fiscal discipline and continue to grow even in a challenging environment. Below, we explore some forces we believe could propel small caps in the year ahead.
Planting the seeds for sustained small cap outperformance?
The past decade was marked by extreme leadership in large cap growth. To put it in context, as of the year ending 2022, the Russell 2000 Growth Index – a measure of small cap growth stocks – had underperformed the Russell 1000 Growth – a measure of large cap growth stocks – by nearly -5 per cent annualized over the past 10 years.
However, we’ve observed over extended periods that leadership between small and large caps tends to be a cyclical phenomenon that can persist anywhere from a few years to over a decade. For instance, the decade prior (12/31/2002 through 12/31/2012) saw small cap growth outperform large cap growth by +2.3 per cent annualized as seen below.
Small and large caps trade leadership over time
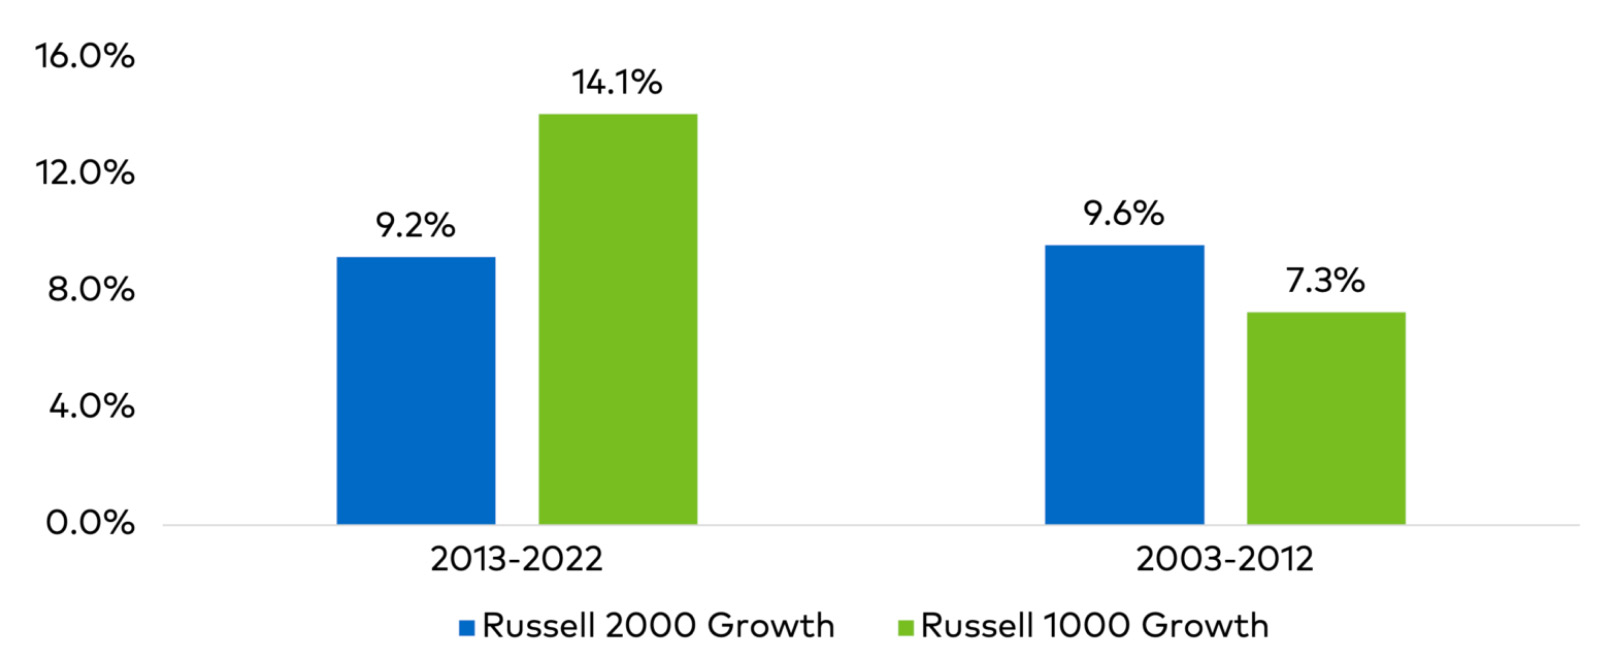
Source: Polen Capital, Bloomberg. “2013-2022” shows performance for the respective indices over the most recent decade ended 12/31/2022. “2003-2012” shows performance for the same indices over the prior decade, ending 12/31/2012.
With the new year now upon us, a fair question would be, “What signs are you seeing that could indicate the cycle is shifting from large cap leadership to small caps leading the way?” To that, we would suggest three potential catalysts:
- Throughout history, bear market recoveries have tended to provide the backdrop for a sustained run of outperformance in small caps.
- Small caps are as inexpensive on an absolute and relative basis (versus large caps) as we’ve seen in a long time, setting the stage for higher expected returns going forward.
- An environment of high and moderating inflation—such as the one we are in now— tends to provide a powerful tailwind to small cap returns.
Small cap leadership out of bear market bottoms
For various reasons, small caps have tended to be the first in line to sell off when concerns about slower economic growth begin to intensify. The logic goes that small caps are usually more cyclically exposed and are more sensitive to an increase in interest rates or a decrease in consumer spending.
For many companies, this is a legitimate risk, and the ensuing decline in share prices may be appropriate given the deteriorating fundamental picture. However, some investors often throw the proverbial baby out with the bathwater during periods of turbulence, providing more discerning investors the opportunity to become owners of high-quality companies where the share price has more than discounted any weakness in the underlying fundamentals.
The events of last year are a great illustration of this. Through the first five months of 2022, the Russell 2000 Growth underperformed the Russell 1000 Growth by -3.0 per cent as markets grappled with the prospect that the Fed’s efforts to combat rising inflation could tip the U.S. into recession. The Russell 2000 Growth was -24.8 per cent as of 5/31/2022, with a quarter of index constituents down -50 per cent or more over this timeframe.
However, by mid-June, the Russell 2000 Growth had bottomed while the Russell 1000 Growth continued to move lower. In real time, it’s hard to attribute a cause for this bottoming in small caps. Still, it is consistent with history in two respects: 1) stocks tend to bottom before economic data bottoms, and 2) small caps tend to lead in bear market recoveries. From mid-June through the end of 2022, the Russell 2000 Growth was up +11.0 per cent, outperforming the Russell 1000 Growth by +8.2 per cent as shown below.
Performance since 2022 small cap bottoms (6/16/2022)
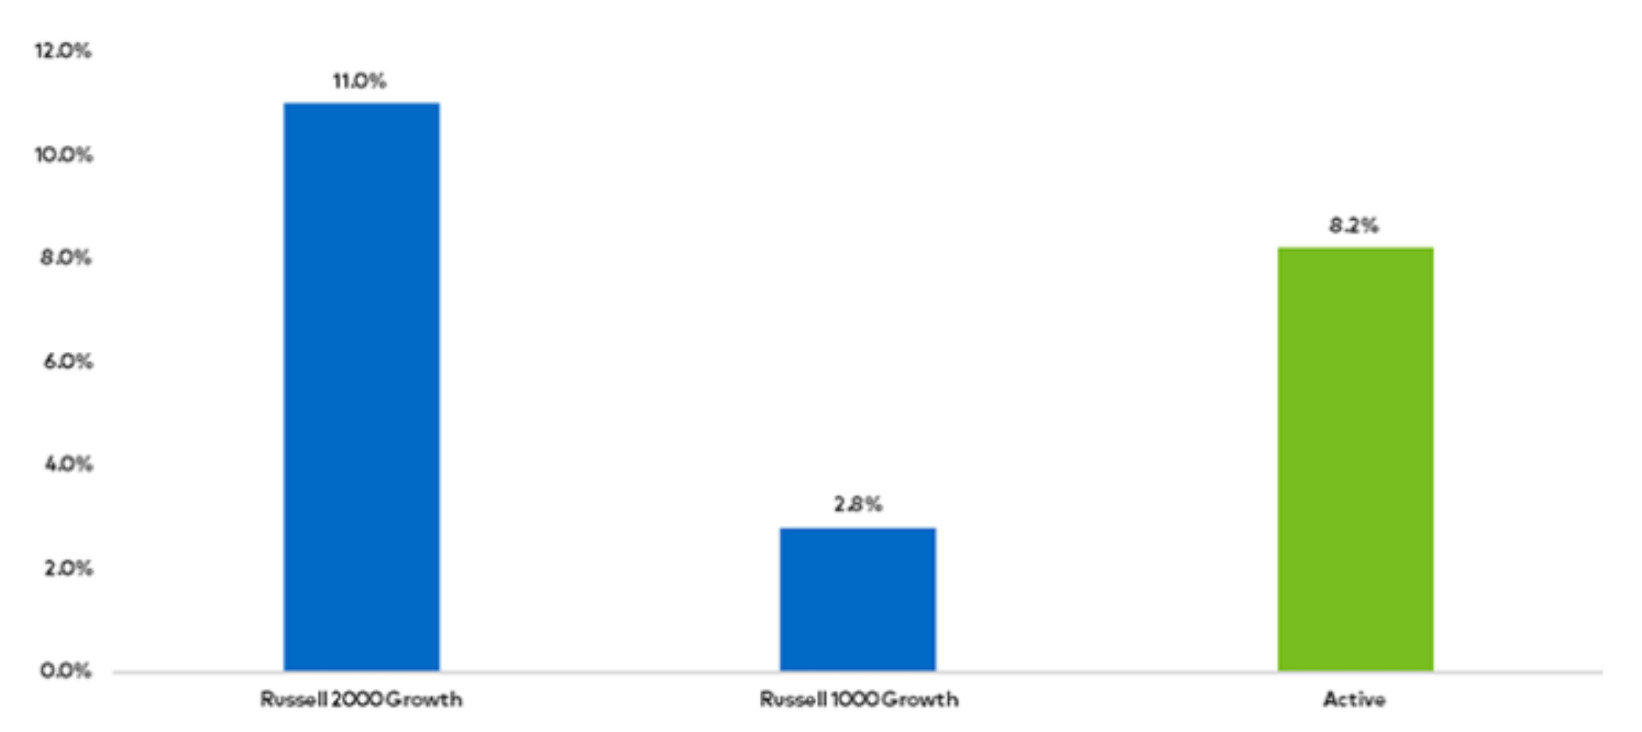
Source: Polen Capital, Bloomberg. Chart shows performance for the respective indices from the Russell 2000 Growth low on 6/16/2022 through 12/31/2022.
On this latter point, the chart below illustrates this phenomenon by displaying a few notable bear markets over the past few decades. Specifically, in the year following a market bottom, small caps have, on average, delivered a +92 per cent total return, outperforming large caps by +29 per cent.
12-Month performance from bear market troughs (2000)
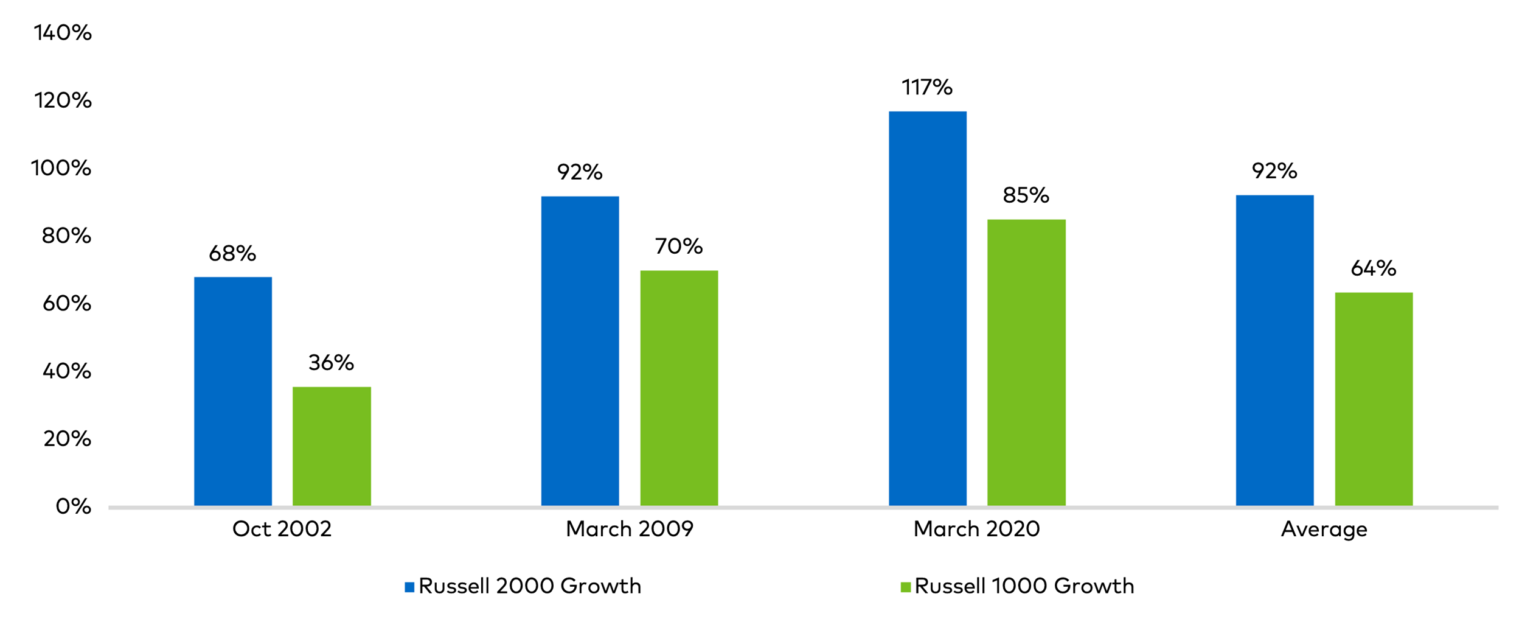
Source: Polen Capital, Bloomberg. Bear market troughs are identified using a measure of the broad U.S. stock market, the S&P 500 Index. Returns are given for the respective indices over the ensuing year from the bear market trough. “Oct-2002” bottom was on 10/9/2002, following the Dotcom Bubble; “March-2009” bottom was on 3/9/2009, following the Global Financial Crisis; “March-2020” bottom was on 3/23/2020, amidst the COVID-19 pandemic.
Trading at a discount: valuations at multi-decade lows
After underperforming their large-cap peers over the last decade, small caps appear undervalued compared to history. Relative to large caps, recessionary fears have had a more pronounced impact on the valuations of small companies, which seem to have baked in gloomier outcomes for the year ahead and are presently trading at a discount.
As noted earlier, when negative sentiment clouds investor judgment, it is not uncommon to see some investors rush for the exit, selling both high-quality and low-quality stocks indiscriminately. Given that “growth” stocks tend to have a more significant portion of their cash flows out into the future as compared to “value” stocks, they are more sensitive to changes in interest rates and, as such, have felt the most acute impact in their stock prices over the past year.
The silver lining is that, in our view, the selloff has created compelling opportunities. Over nearly 30 years of data, rarely have small caps been this inexpensive. In absolute terms, you must go back to the Global Financial Crisis timeframe (2008-2009) and the post-Dotcom Bubble era to see comparable valuations.1 In relative terms versus large caps, small caps have only been this inexpensive 7 per cent of the time over the past 28 years. While valuation is not a precise mechanism around when to time an allocation, it shows that future expected returns for small caps are as attractive as we have seen for long-term investors looking to add to their portfolios opportunistically.
Russell 2000 growth forward 12-month P/E
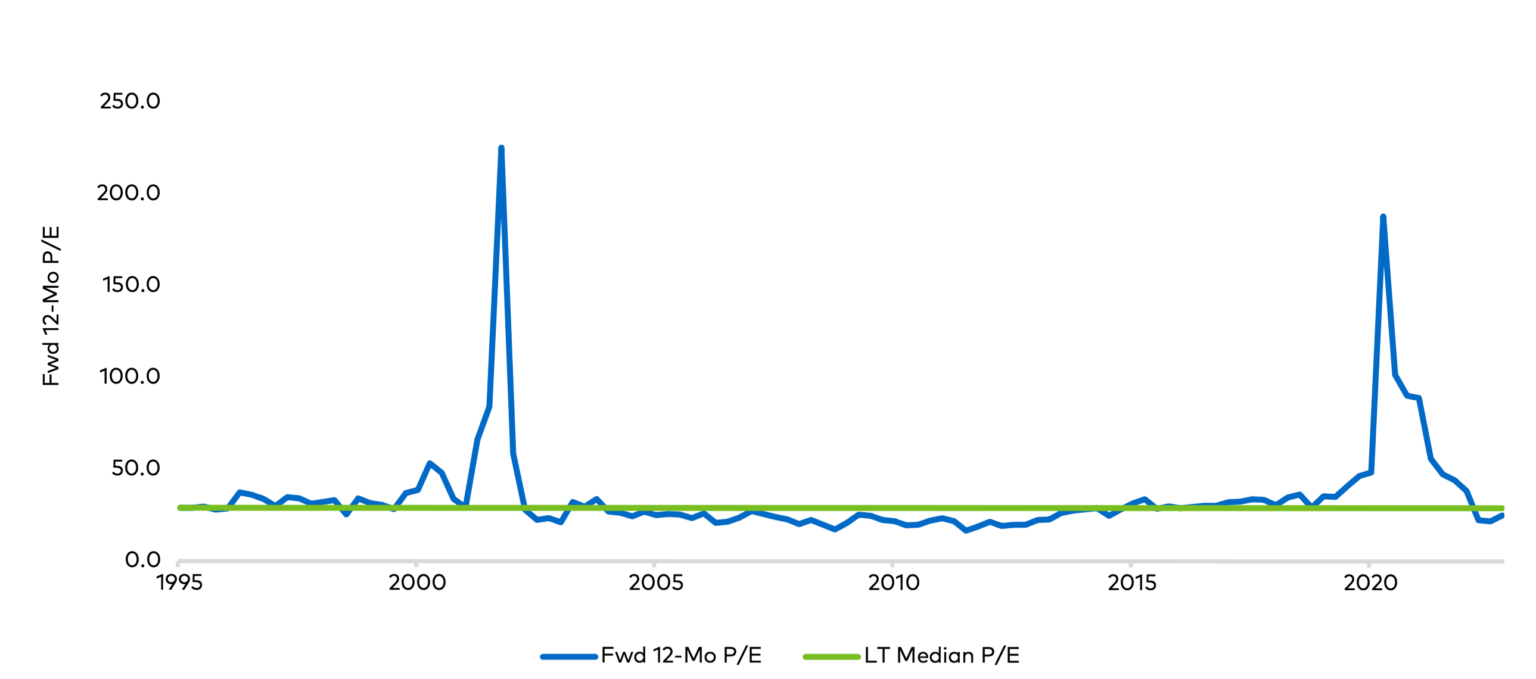
Source: Polen Capital, Bloomberg. Data shown from 3/31/1995 (earliest data available in Bloomberg) through 12/31/2022. Shows P/E ratio based on Forward 12-month Bloomberg consensus estimates, which are subject to revision over time. The green line indicates the median Forward 12-month P/E over the period shown.
Small Caps and Monetary Policy
While valuations are at some of the most attractive levels we have seen in years, there are other reasons why we maintain a constructive view of the asset class. In early 2022, the Fed quickly changed its stance from inflation being transitory to be more persistent. In short order, the Fed embarked on a historically rapid rate hike cycle that saw the Federal Funds Target Rate go from near zero at the beginning of the year to 4.5 per cent by the end of the year. This had an outsized impact on growth stocks given their “long duration” nature, with cash flows out into the future being discounted back at higher rates.
But as we got into the middle part of the year, the consumer price index (“CPI”) peaked at +9.1 per cent year-over-year in June 2022 and started to decline at the end of the year. As the year progressed, the consensus shifted from “we’re going into a deep recession” to “perhaps this will be a mild recession or even a soft landing.” While it’s impossible to predict the macroeconomic outlook, small caps tend to do best in an environment of high but falling inflation, as our analysis below demonstrates.
Going back to the inception of the Russell indices at the end of 1978, we looked at four different market environments:
- Inflation above 3 per cent and rising year-over-year
- Inflation above 3 per cent and falling year-over-year
- Inflation below 3 per cent and rising year-over-year
- Inflation below 3 per cent and falling year-over-year
It’s in the last bucket (high but falling inflation) that small caps have tended to do best in absolute and relative terms.
Russell 2000 Growth Average Absolute Returns by Macro Environment
| <3% CPI | >3% CPI | |
| Rising YoY Inflation | 14.00% | 0.90% |
| Falling YoY Inflation | 11.60% | 27.20% |
Russell 2000 Growth Average Relative Returns vs. Russell 1000 Growth, by Macro Environment
| <3% CPI | >3% CPI | |
| Rising YoY Inflation | -0.80% | -5.10% |
| Falling YoY Inflation | -1.60% | 6.30% |
Source: Polen Capital, Bloomberg. Data is shown from the inception of the Russell style indices (12/31/1978) through 12/31/2022. Methodology: 3 per cent is used as a dividing line for high and low inflation. Rising/Falling YoY Inflation is measured by looking at CPI for a given year and how it compares to the previous year. For example, 2022 would count as a high (>3 per cent) and rising YoY inflation year, and the calendar year return would influence the upper right-hand corner of the table. The observations are summarized for each box in the table with a straight average of the calendar year’s performance. Sticking with the high and rising example, there are 12 years since 1978 where this has been the case. The average of those years shows the Russell 2000 Growth delivered +0.9 per cent absolute returns on average.
Could quality be the key to small cap investing?
Conventional wisdom suggests that small caps can be inherently more volatile than large caps during periods of slower economic growth and tighter financial conditions. While there is some truth behind this generalization, painting every small cap company with the same brush can be misleading. Though we agree that certain companies—mainly those with unprofitable business models, high debt levels, and low returns on invested capital—could be susceptible to headwinds during tough times, high-quality small caps might survive and grow even in the face of adversity.
To this point, many high-quality small cap businesses posted surprisingly robust earnings results last year, showcasing fiscal discipline in managing their expenses and leaning into pricing power where possible. Additionally, we believe that high-quality companies with durable economic moats have more financial flexibility and pricing power, which helps dampen the impact of external forces.
In the case of many innovative small caps, we believe developing disruptive technologies and opening new markets are some examples of more critical determining factors of their future long-term success. As we move forward, we believe we will see an increasing dispersion in the performance of high-quality and low-quality businesses, given a more normalized interest rate landscape that should return the focus to company-specific drivers.
Investor key takeaways
Going forward, the severity of an impending recession, the path of inflation and interest rates, and geopolitics will continue to influence markets. While the market’s risk appetite may turn quickly or resume slowly, we believe that investing in small caps today may give investors with a long-term horizon an exceptional opportunity to own some of tomorrow’s most successful businesses at attractive prices. To recap:
- Looking through history, bear market recoveries have tended to provide the backdrop for a sustained run of outperformance in small caps.
- Small caps are historically inexpensive on an absolute and relative basis (versus large caps), setting the stage for higher expected returns.
- An environment of high and falling inflation—such as the one we are in now—tends to provide a powerful tailwind to small cap returns.
American investor Shelby Cullom Davis once said:
“You make most of your money in a bear market; you just don’t know it at the time.
Despite the bumpy near-term outlook, we believe that the underlying growth story in small caps remains intact, and the investment opportunity for the asset class is as attractive as we have seen in many years.
1 The Global Financial Crisis (“GFC”) refers to the period of extreme stress in global financial markets and banking systems between mid-2007 and early 2009. During this period, the S&P peaked in Oct-2007 and bottomed in Mar-2009. The Dotcom Bubble was a rapid rise in U.S. technology stock equity valuations fueled by investments in Internet-based companies in the late 1990s. During this period, the S&P peaked in Mar-2000 and bottomed in Oct-2002.
This information is provided for illustrative purposes only. Opinions and views expressed constitute the judgment of Polen Capital as of February 2023 may involve a number of assumptions and estimates which are not guaranteed and are subject to change without notice or update. Although the information and any opinions or views given have been obtained from or based on sources believed to be reliable, no warranty or representation is made as to their correctness, completeness or accuracy. Opinions, estimates, forecasts, and statements of financial market trends that are based on current market conditions constitute our judgment and are subject to change without notice, including any forward-looking estimates or statements which are based on certain expectations and assumptions. The views and strategies described may not be suitable for all clients. This document does not identify all the risks (direct or indirect) or other considerations which might be material to you when entering any financial transaction.
The information in this document has been prepared without taking into account individual objectives, financial situations or needs. It should not be relied upon as a substitute for financial or other specialist advice. This document is provided on a confidential basis for informational purposes only and may not be reproduced in any form or transmitted to any person without authorization from Polen Capital Management.
The volatility and other material characteristics of the indices referenced may be materially different from the performance achieved by an individual investor. In addition, an investor’s holdings may be materially different from those within the index. Indices are unmanaged and one cannot invest directly in an index. The performance of an index does not reflect any transaction costs, management fees, or taxes.
Established in 1979, Polen Capital is a high conviction growth investment manager with offices in the US and UK. Polen has been dedicated to serving investors by providing concentrated portfolios of the highest-quality companies for more than three decades. The firm’s established team manages US$71 billion in total assets and their longest-running flagship investment strategy has delivered on average double digit annual returns for more than 30 years.
This post was contributed by a representative of Montgomery Investment Management Pty Limited (AFSL No. 354564). The principal purpose of this post is to provide factual information and not provide financial product advice. Additionally, the information provided is not intended to provide any recommendation or opinion about any financial product. Any commentary and statements of opinion however may contain general advice only that is prepared without taking into account your personal objectives, financial circumstances or needs. Because of this, before acting on any of the information provided, you should always consider its appropriateness in light of your personal objectives, financial circumstances and needs and should consider seeking independent advice from a financial advisor if necessary before making any decisions. This post specifically excludes personal advice.