What does rising volatility mean?
Working in derivatives trading back in the early nineties, one of the aphorisms that became a gospel-given truth was, ‘volatility is heightened at turning points’. It has been my experience that volatility clusters around turning points, but perhaps I only remember that because I want to. If big moves also occur in the middle of bull and bear markets, my aphorism becomes the product of selective memory.
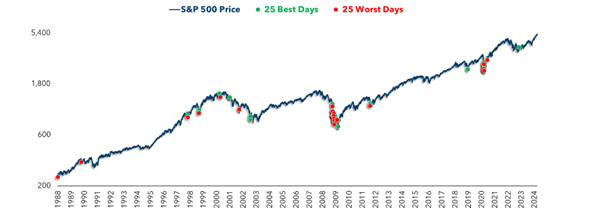
Figure 1. S&P500: 25 best and worst days – 1988-2024
 Source: Ritholtz Wealth Management
Figure 1., reveals there’s some merit in the idea of heightened volatility at turning points. You will note the big days, up and down, tend to cluster around turning points. While the next question might be whether they are causal or symptomatic, what is important is that investors may want to be on alert when large swings start stacking up.
If you remember, bull markets that expand over the years are boring affairs. They sneak up on the investor who frequently wishes they had ‘bought earlier’. Consequently, they wait for a correction that doesn’t arrive, and while they wait there is no emotion – no panic.
It is emotion and even panic that drives larger moves in the market. Either panic selling or panic buying. In the absence of panic, the market doesn’t record large relative moves. Volatility rises at intermediate market highs and lows due to a conflict between bullish and bearish investors. At new highs, optimists argue with the bears, who invariably describe the market as overvalued. At or near market lows, pessimism clashes with value-seeking investors and those hopeful for a rebound.
Historical data supports this pattern. During the 2008 financial crisis and the 2020 pandemic-induced crash, volatility spiked dramatically as markets plummeted before eventually finding a bottom. This well-documented phenomenon, therefore, highlights the uncertainty and heightened emotions that often accompany significant market shifts.
Recently, market activity is displaying a notable increase in volatility, suggesting major stock indices may be hovering near a turning point.
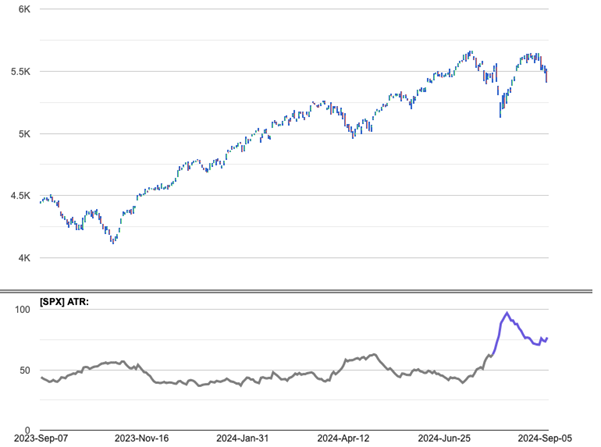
Figure 2. S&P500, 14-day Average True Range
 Figure 2., displays the S&P500 over the last 12 months alongside the 14-day average true range. The recent heightened volatility is manifested in the exponential spike in the average true range line.
Elsewhere, the Chicago Board Options Exchange’s Volatility Index (VIX), often called the market’s “fear gauge,” has risen 30 per cent in recent weeks, reflecting growing investor anxiety.
While I remain optimistic about markets for the remainder of 2024 and for 2025, that stance is dependent on both the persistence of positive economic growth and disinflation. Since the 1970s, and without exception, whenever disinflation and positive economic growth have co-existed, innovative companies with pricing power have done well. And as I have always caveated, there will be bumps along the way.
The current heightened volatility suggests we are journeying over one of those bumps right now. Investors are right to prepare for continued turbulence in the short term, and while volatility can be unsettling, it’s normal. In the absence of cataclysmic new information, long-term investors should remain focused on their goal of accumulating shares in a portfolio of high-quality businesses with sustainable competitive advantages and avoid making the emotional decisions that fuel the very short-term volatility we describe here.