
The US S&P 500 in context
Since peaking on 19 February 2020 at 3,394 points, the US S&P 500 declined by 1,202 points or 35 per cent to 2,192 points recorded on 23 March. The ensuing 565 point rally (up 26 per cent) to last night’s post-crash high of 2,757 points (Tuesday 7 April) is a 47 per cent retracement of the decline, but still 19 per cent from the record high.
The question of course is do we buy or sell this rally, and today’s blog is designed to give you some context on my thinking.
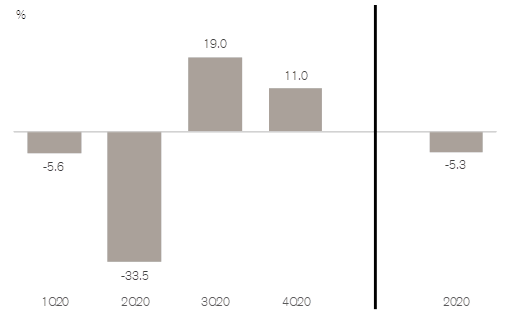
Firstly, let’s look at estimates for Real GDP change in the US for the calendar 2020 year.
| March 2020 Quarter | -5.6% |
| June 2020 Quarter | -33.5% |
| September 2020 Quarter | +19.0% |
| December 2020 Quarter | +11.0% |
| Calendar 2020 Year | -5.3% |
The negative 5.3 per cent forecast for the calendar 2020 year is nearly double the negative 2.8 per cent recorded in the calendar 2008 year. However, the crucial point is the forecast contraction in Real GDP of negative 33.5 per cent in the June 2020 Quarter is the worst quarter on record (since 1945). For perspective, this is 3-4 times worse than the previous two worst quarters on record, being negative 10.0 per cent in Q1 1958 and negative 8.4 per cent in Q4 2008.
Real GDP Change – Fresh Consensus Estimates
Real GDP – Fresh Consensus Estimates
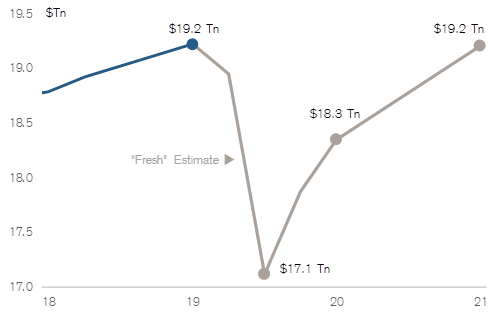
Source: Credit Suisse Securities (USA) LLC
Second, how does this play out in terms of Earnings Per Share (EPS) forecasts and the Prospective PE ratios for the S&P 500 at the three levels mentioned in my introduction?
| Calendar Year | 2020 | 2021 |
| EPS forecast | US$120 | US$150 (+25%) |
| PE at 3,394 points (19/2/20) | 28.3X | 22.6X |
| PE at 2,192 points (23/3/20) | 18.3X | 14.6X |
| PE at 2,757 points (7/4/20) | 23.0X | 18.4X |
The starting point for the EPS forecast for each of calendar 2020 and 2021 approximated US$180, and at the all-time high of 3,394 points (19/2/200) this put the market on a prospective PE of 19X.
While the top down EPS forecast for calendar 2020 is US$120, the current bottom-up forecast – analysts are historically very slow to move their forecasts at economic inflection points – is around US$145. At last night’s high of 2,747 points, the prospective PE for 2020 is again 19X.
Post the recent retracement, the market has come down by 19 per cent from 3,394 to 2,757 points while the bottom-up EPS forecast has also come down 19 per cent from US$180 to US$145. And hence the prospective PE for calendar 2020 remains 19X, as illustrated below.
S&P 500 NTM P/E
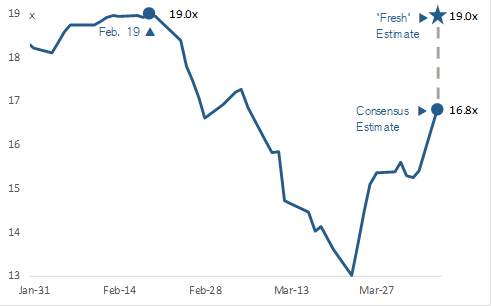
Source: Credit Suisse Securities (USA) LLC
I believe the expected 33.5 per cent contraction in the Real GDP for US economy in the June 2020 quarter will likely see both the bottom-up and consensus EPS forecasts decline significantly from here.
And a final word from a life-long friend of mine who works for Janus Henderson in Denver Colorado, “While it is tempting to join this rally, I would wait until the full impact on unemployment and earnings are felt, as shutting down most of the US economy will be ugly. The market is looking at the curve and trying to get in front of it and the herd mentality is pretty strong. I think human behaviour will change as a result of the shutdown as consumers will tend to save more and are not as likely to travel or go to crowded sporting events until a vaccine is found.”
Chief Executive Officer of Montgomery Investment Management, David Buckland has over 40 years of industry experience.
David is a deeply knowledgeable and highly experienced financial services executive. Prior to joining Montgomery in 2012, David was CEO and Executive Director of Hunter Hall for 11 years, as well as a Director at JP Morgan in Sydney and London for eight years.
This post was contributed by a representative of Montgomery Investment Management Pty Limited (AFSL No. 354564). The principal purpose of this post is to provide factual information and not provide financial product advice. Additionally, the information provided is not intended to provide any recommendation or opinion about any financial product. Any commentary and statements of opinion however may contain general advice only that is prepared without taking into account your personal objectives, financial circumstances or needs. Because of this, before acting on any of the information provided, you should always consider its appropriateness in light of your personal objectives, financial circumstances and needs and should consider seeking independent advice from a financial advisor if necessary before making any decisions. This post specifically excludes personal advice.
Thank you David, gives me a simple scenario model to play what ifs.
Thanks Derek. And to complicate things, the Elliot Wave Theorists are looking for an ABC decline, and are arguing we are currently in the B wave – retracing the initial decline. So far the S&P 500 has moved up 627 points or 29% (from 2,192 to 2,819) or 52% of its 1,202 point loss. That makes it 17% from its peak of 3,394 points. The Australian All Ordinaries Index at 5,440 points has recovered 980 points or 35% of its loss (7,290 – 4,460 points = 2,830 points). It is up 22% from its low, and currently 25% from its peak. That said, I have never met a wealthy chartist.
Interesting thoughts. While I agree with the logic. It does seem like this article is trying to predict market direction. The herd rarely follows the logic. Interest rates are so low that holding cash is like sand in your hand slowly eroding away. Stocks are still cheap now. Sitting on the sidelines is a dangerous move. If the herd decide they don’t care about your numbers above the market will recover while your still trying to hold onto the sand. Grab a bargain now keep a little dry powder in case your prediction it’s accurate. A bird in the hand is worth 2 in the bush.
Hi Guy, cash is like sand in your hand slowly eroding way until you miss a 35 per cent decline in the market (and a 60% decline in several stocks), and suddenly it gives you lots of optionality. That said, I accept the vast majority of investors find it virtually impossible in getting both sides of the equation right – having no cash into a strongly rising market and tonnes of cash into a severe market decline. But for most investors, there is a balance. The Montgomery domestic funds have bought or added to four or five very high quality stocks in recent weeks including Sydney Airports, Atlas Arteria, Magellan Financial Group and CBA and I’m sure we will add more as dozens of companies go through a re-capitalisation process in the June 2020 Quarter. Thank you.
I recently saw an amazing chart in a US based newsletter I subscribe to that showed the incredible amount of money spent on share buybacks and the influence this has had on the US market in the last few years. I understand that COVID19 US government assistance packages to industry in the US come with strings that do not allow share buybacks. Interested if this sudden decline will have an impact on US markets going forward and if the same scenario could apply in Australia.
Hi Chris, US stocks generally have a very low dividend yield but many make this up via share buy-backs. So if share buy-backs are cancelled it should not change the value of the underlying company, but will reduce the stock market “demand” for the company’s shares. Its a bit like the Aussie Banks looking to cancel their dividends. It should not really change their valuations, but because so many investors rely on their dividends, demand for said Banks will decline at the margin (and at the time of the announcement, I would expect an increase in short-term supply). I hope that helps. Thank you.