The Phillips Curve – will we see higher US inflation?
The Phillips curve describes the historical inverse relationship between rates of unemployment and corresponding rates of inflation. The theory states that with economic growth comes more jobs, less unemployment and inflation. The degree to which this inverse relationship has been affected by globalisation, digital deflation and outsourcing is a moot point and we wonder if, and when, the 17-year low in US unemployment will filter through to a higher sustainable rate of inflation?
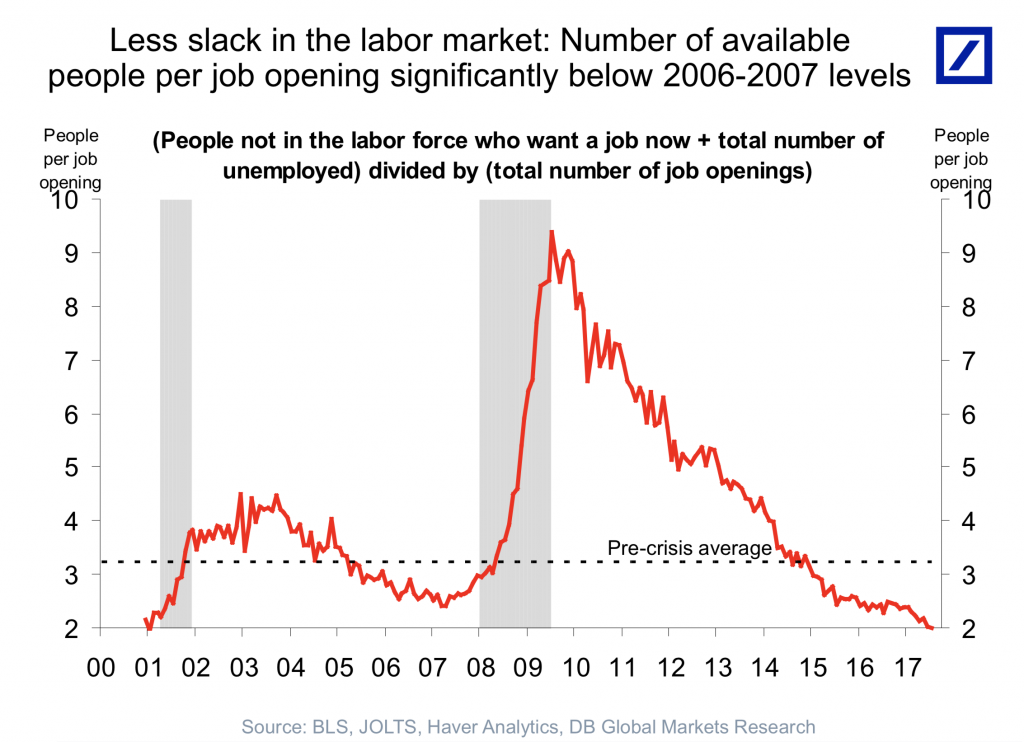
Despite the negative effects on the retailing sector from digital deflation, the US unemployment rate has hit its lowest level in 17 years at 4.2 per cent and the number of available people per job opening is now significantly below the 2006-2007 levels (when the US Federal Funds rate approximated 5.0 per cent).
After many false starts, the Phillips Curve Trade Off – the historical inverse relationship between rates of unemployment and corresponding rates of inflation – may be about to commence with many stimulatory factors appearing to come together.
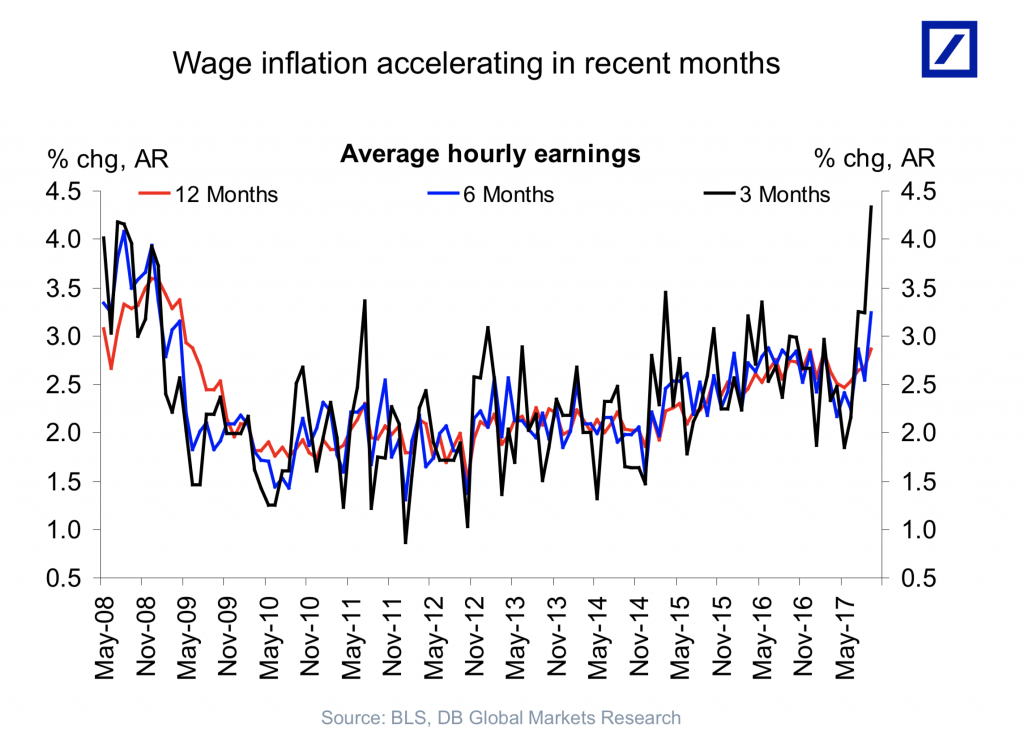
Firstly, with the multi-year low in unemployment, we have seen an acceleration in US wage inflation in recent months; second, the Trump Administration is doing everything in its power to push through tax cuts for households and corporates; and third, the weaker US Dollar for much of 2017 should assist growth.
The US Federal Reserve has indicated its intention to increase the US Fed Funds Rate from 1.25 per cent to 1.50 per cent in December 2017. If this occurs, it would be the fourth 0.25 per cent tightening in twelve months, the others being in December 2016, March 2017 and June 2017.
The US Federal Reserve has also indicated its intention to commence unwinding the US$4.5 trillion balance sheet of bonds and other securities.
After hitting a record low yield in June 2016 at 1.45 per cent, some commentators believe with the congruence of stimulus the US Ten Year Government Bonds (currently 2.35 per cent) could soon challenge 3.0 per cent, a level last seen in late 2013.


It blows my mind that with all this happening, the market is still stubborn re: the USD. It just doesn’t believe that any of this is happening. And of course the AUD has only blue skies ahead, what with a housing bubble, consumers drowning in debt and China on the edge of a cliff. I guess the Monti narrative of the AUD in the 60’s is no longer on the table for ’17 ? Unfortunately the curreny has made the returns on the Montaka fund look downright ordinary at exactly 0% for 2 years in AUD terms.
Thanks Peter. I still think the A$ will see the 60’s at some stage. I think you’ll find Montaka has returned 2.3% p.a. for the two years to 30/9/17. Maybe you disregarded the 30/6/16 distribution.