
Comparing NAB to ANZ
Following on from ANZ’s trading update last week, NAB reported its June quarter trading update today. NAB reported 9 per cent growth in cash earnings for the quarter to A$1.75 billion. This appeared to comfortably beat ANZ’s cash earnings growth of 4 per cent for the same quarter. However, there were a number of notable quality differences in the period.
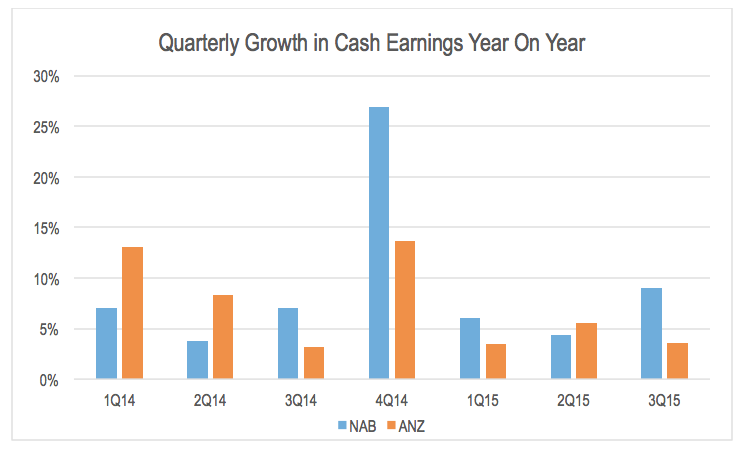
Source: Company data
The first was in terms of provisioning. ANZ noted that its collective provision charge increased due to balance sheet growth and an increase in provisioning for the resources and agricultural sectors. This resulted in a 49 per cent increase in ANZ’s bad debt provisioning for the quarter to A$366 million.
By contrast, NAB’s bad debt provisions charge fell 20 per cent on the prior year to A$193 million. Interestingly, the primary reason for the reduction provided by NAB was a lower provisioning for resources and agriculture after increasing the charge against these sectors in the March quarter.
If we look at the cash earnings growth of both companies before this non-cash charge, ANZ’s earnings growth was actually stronger than NAB’s in the June quarter.
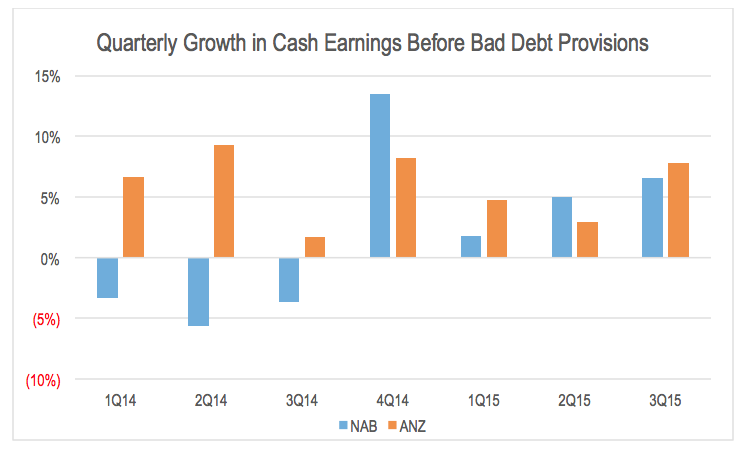
Source: Company data and MIM analysis
Of course bad debt provisions, while non-cash, are a significant component in the assessment of a bank’s asset quality. However, they can be volatile on a quarterly or even yearly basis. In looking at the sustainable earnings and return generation, it is important to assess the sustainable long term level of bad and doubtful debt provisions.
In terms of underlying operating profit, NAB indicated that while revenue growth was 4 per cent, this was boosted by around 2ppts by one off factors including profits on sale of assets. Underlying revenue growth was 2 per cent. When compared to expense growth of 4 per cent, the implication is that NAB’s expense ratio increased in the period and margins fell. This is due to weak Markets & Treasury revenue, as well as competition for business lending.
NAB reported higher asset volumes offset by lower margins in business lending.
If we assume a 40 per cent expense ratio, the combination of underlying revenue growth of 2 per cent and expense growth of 4 per cent implies underlying operating profit growth close to zero.
By contrast, ANZ indicated that revenue growth was roughly in line with expense growth. Additionally revenue growth accelerated and expense growth slowed relative to 1H15. Net interest margin was broadly stable.
Last, NAB’s results would have benefited to a small extend from the capital raising in May. This is likely to have added just under 1ppts to cash earnings growth in the June quarter. At the same time, the raising dilutes Earnings Per Share (EPS) by around 5 per cent relative to the same period in 2014.
When you look beneath the surface at the earnings NAB reported as being a “good quarterly result with continuing momentum” and strip out low quality adjustments, one offs, and equity dilution, underlying EPS has actually fallen relative to the June quarter last year.
Maybe NAB needs a little more take and a little less give.
The information in this blog is general in nature and is not a recommendation or a solicitation to deal in any security. Please do your own research and consult a licensed financial advisor where appropriate.
The Montgomery Fund and The Montgomery Private Fund hold positions in ANZ Banking Group.
Stuart Jackson is a Senior Analyst with Montgomery Investment Management. To invest with Montgomery domestically and globally, find out more.
This post was contributed by a representative of Montgomery Investment Management Pty Limited (AFSL No. 354564). The principal purpose of this post is to provide factual information and not provide financial product advice. Additionally, the information provided is not intended to provide any recommendation or opinion about any financial product. Any commentary and statements of opinion however may contain general advice only that is prepared without taking into account your personal objectives, financial circumstances or needs. Because of this, before acting on any of the information provided, you should always consider its appropriateness in light of your personal objectives, financial circumstances and needs and should consider seeking independent advice from a financial advisor if necessary before making any decisions. This post specifically excludes personal advice.
INVEST WITH MONTGOMERY
A great post Stuart – thanks. You seem to be able to delve much deeper and identify the true trends and drivers. I noticed that the Montgomery Fund took a haircut last week, presumably from the ANZ position impact – while I understand you cannot comment on what you are buying (or selling) it is reassuring to know that ANZ might have a brighter future than the punters would believe, especially with the windfall gains from increasing investor mortgage rates like the others in the big 4.. Very best wishes team MIM…