
P/E multiple movements promote equity market volatility
When I joined the financial services industry nearly four decades ago, many high-quality industrial businesses were on a single digit P/E multiple. Interest rates and inflation were extremely high, and an old-timer in the office used to apply a rule that the P/E multiple plus inflationary expectations should approximate 20.
Fast forward, and there are many high-quality industrials with P/E multiples exceeding 20 times, and this is despite the likelihood inflationary expectations could stay well above four per cent over the foreseeable future.
The point is P/E multiples can also move around quite significantly over the shorter-term too. Calendar 2022 was a case in point, and the sharp increase in the yield on U.S. ten-year treasury bonds from 0.5 per cent in mid-2020 to breach 4.0 per cent by the December 2022 Quarter was, in combination with sharply rising official cash rates, the catalyst for the deterioration of the P/E multiple and the negative 18 per cent total return from the US-based S&P 500.
This data, courtesy of Credit-Suisse, is broken down in the table below for the S&P 500, Russell 1000 Growth, Russell 1000 Value and the Russell 2000. Analysis for both Calendar 2022 and the first two months of calendar 2023 highlights the sharp percentage movement in the P/E multiple (particularly relative to changes in earnings per share (EPS)).
|
Calendar 2022 |
EPS (%) |
+PE (%) |
=Price Return (%) |
+Dividends (%) |
=Total Return (%) |
|
|
|
|
|
|
|
|
S&P 500 |
3.1 |
-21.9 |
-19.4 |
1.7 |
-18.1 |
|
Russell 1000 Value |
4.9 |
-13.8 |
-9.6 |
2.3 |
-7.5 |
|
Russell 1000 Growth |
1.3 |
-30.7 |
-29.8 |
1.0 |
-29.1 |
|
Russell 2000 |
7.3 |
-26.9 |
-21.6 |
1.4 |
-20.4 |
To what degree has significantly higher U.S. bond yields, the tightening Federal Reserve official cash rates (from 0.1 per cent to 4.75 per cent in the past 12 months), and the downward pressure on EPS expectations over calendar 2023, led to the sharply deteriorating P/E multiple in calendar 2022?
|
January and February 2023 |
EPS (%) |
+PE (%) |
=Price Return (%) |
+Dividends (%) |
=Total Return (%) |
|
|
|
|
|
|
|
|
S&P 500 |
-1.4 |
4.9 |
3.4 |
0.3 |
3.7 |
|
Russell 1000 Value |
-2.2 |
3.4 |
1.1 |
0.4 |
1.5 |
|
Russell 1000 Growth |
-0.1 |
7.0 |
6.9 |
0.2 |
7.0 |
|
Russell 2000 |
-2.6 |
10.5 |
7.7 |
0.2 |
7.9 |
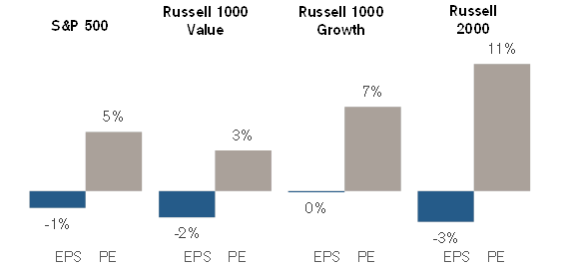
The table above (which saw the S&P 500 up 6.5 per cent in January 2023 and decline by 2.4 per cent in February 2023, for a two-month total return of 3.7 per cent) again highlighted the percentage movement of the P/E multiple (relative to the declining EPS).
Given the sharp percentage movements – up and down – for P/E multiples, it is very difficult to forecast shorter-term movements in markets, and for this reason it is generally best to stay with a portfolio of high-quality businesses with solid growth prospects.
EPS and PE Contribution to YTD Return
Chief Executive Officer of Montgomery Investment Management, David Buckland has over 40 years of industry experience.
David is a deeply knowledgeable and highly experienced financial services executive. Prior to joining Montgomery in 2012, David was CEO and Executive Director of Hunter Hall for 11 years, as well as a Director at JP Morgan in Sydney and London for eight years.
This post was contributed by a representative of Montgomery Investment Management Pty Limited (AFSL No. 354564). The principal purpose of this post is to provide factual information and not provide financial product advice. Additionally, the information provided is not intended to provide any recommendation or opinion about any financial product. Any commentary and statements of opinion however may contain general advice only that is prepared without taking into account your personal objectives, financial circumstances or needs. Because of this, before acting on any of the information provided, you should always consider its appropriateness in light of your personal objectives, financial circumstances and needs and should consider seeking independent advice from a financial advisor if necessary before making any decisions. This post specifically excludes personal advice.