Markets are euphoric! Maybe.
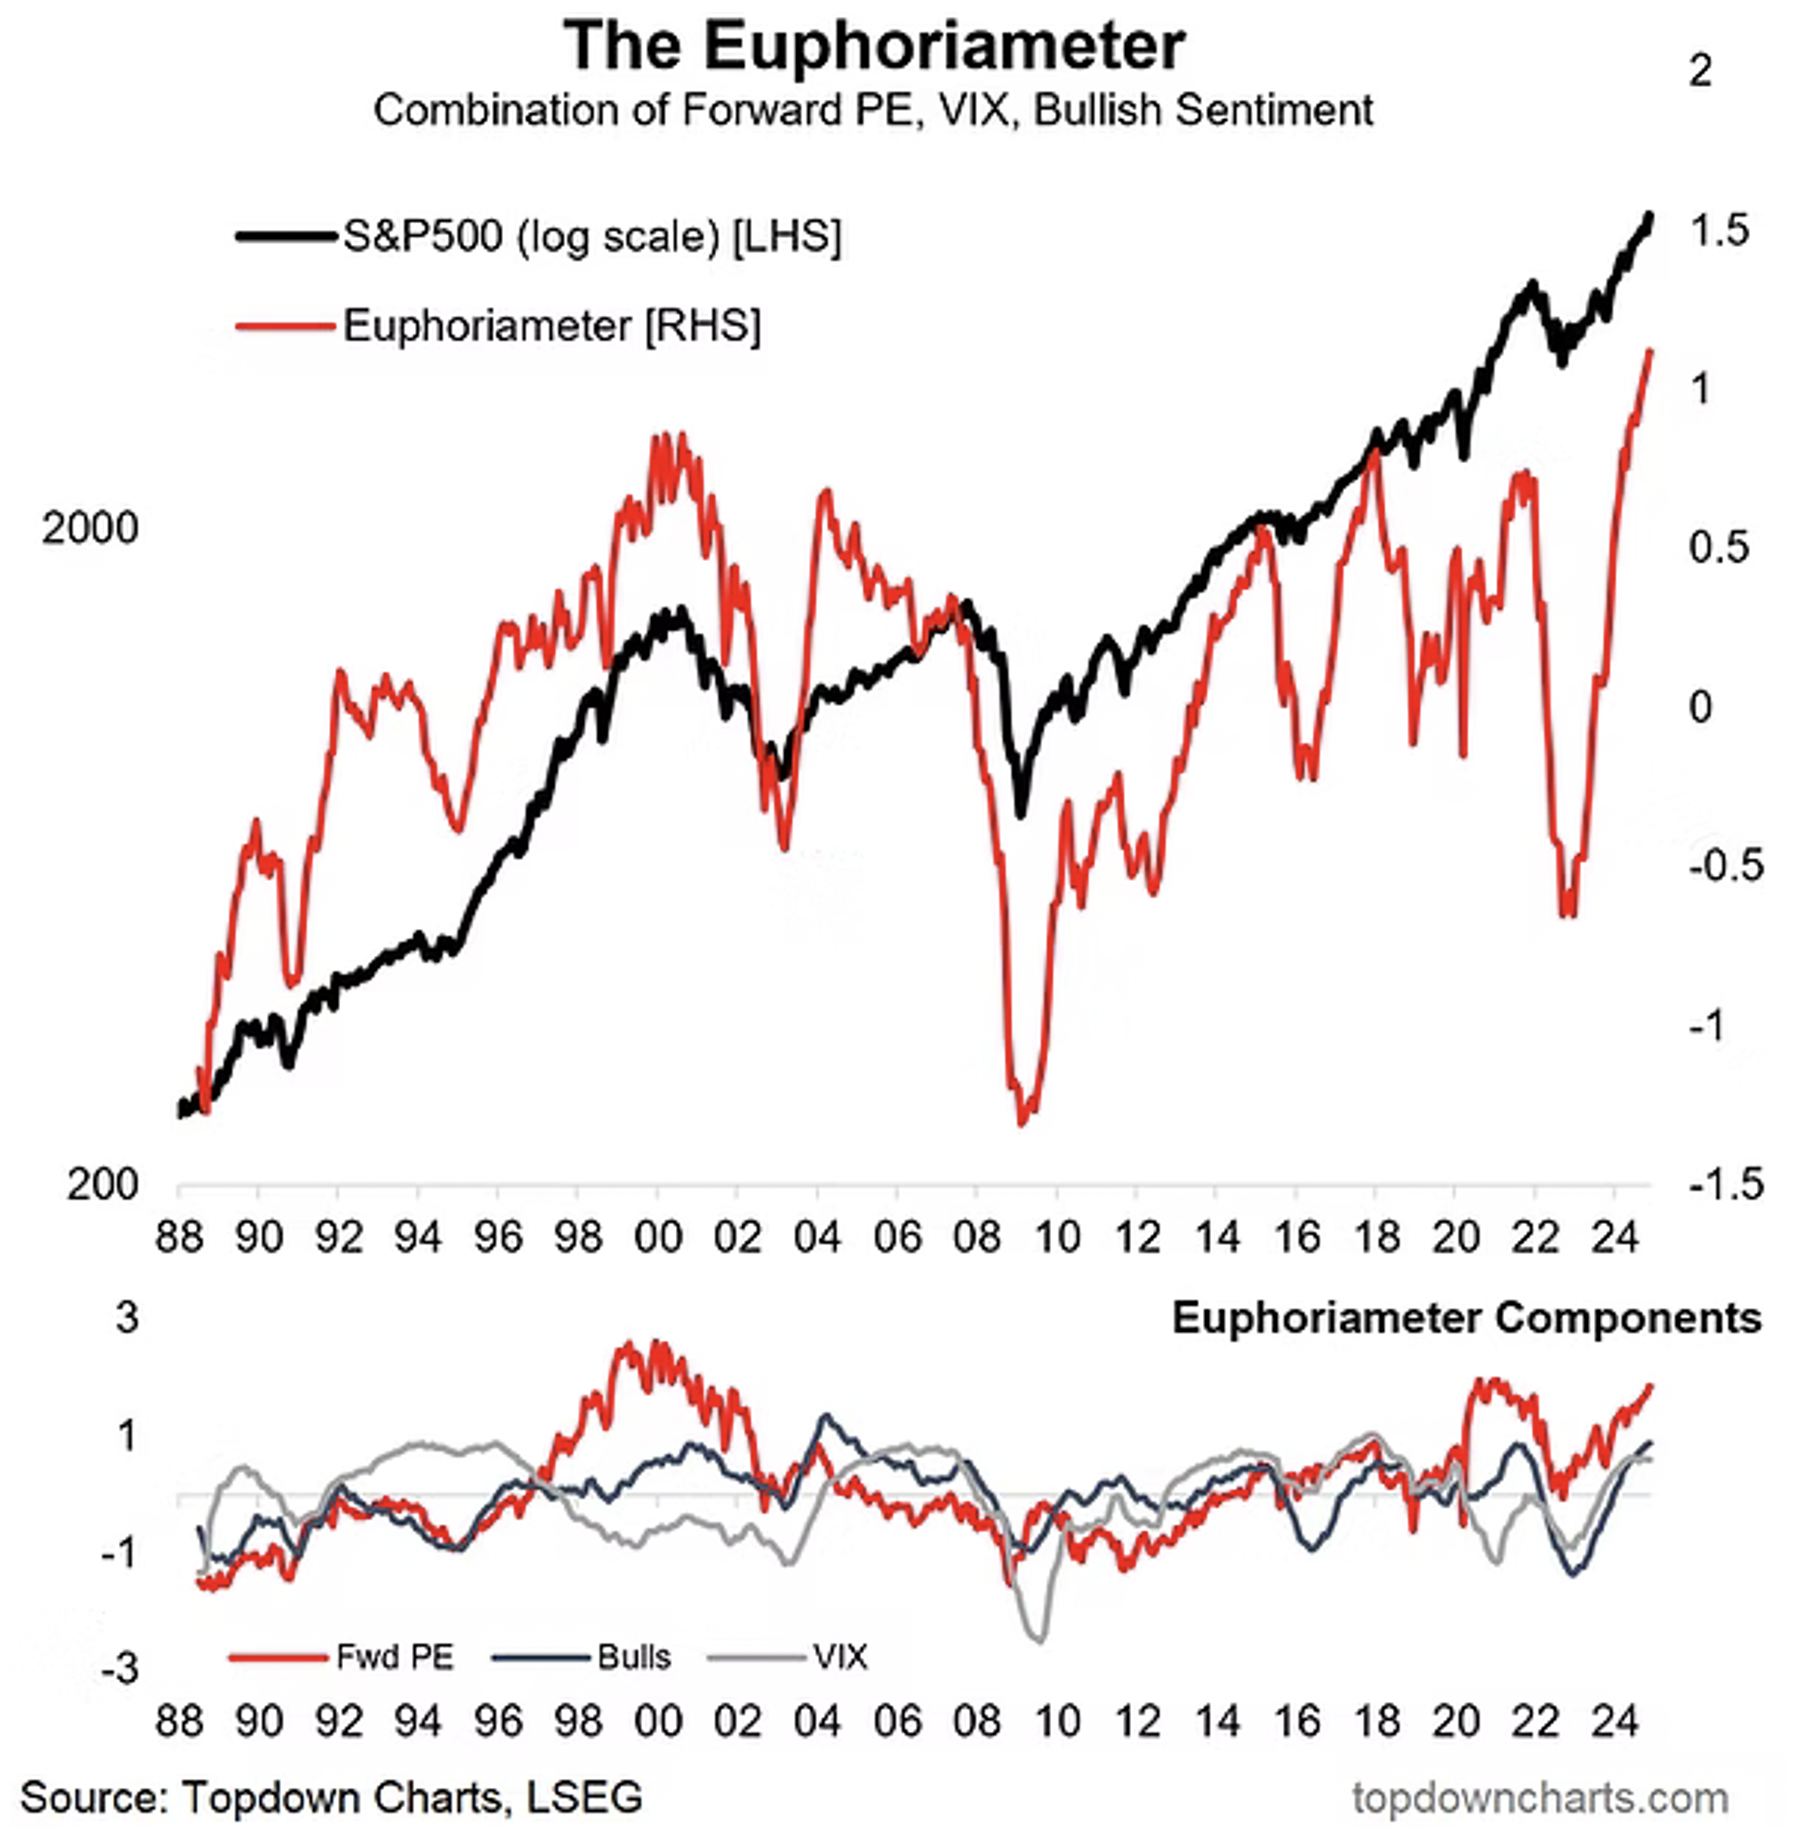
According to multiple commentators and outlets reporting on those commentators, the equity market is now at a euphoric level – officially. Evidently, there’s a measure for euphoria produced by Callum Thomas, the founder of Topdowncharts, in Queenstown, New Zealand.
Figure 1. Bullish extreme

Thomas’s Euphoriameter combines bullish sentiment readings from investor surveys, forward price-to-earnings (P/E) Ratios and implied volatility in a mean-reverting indicator that seeks to inform investors of extreme enthusiasm and despondency.
The consequence of euphoria is high prices. Remembering the idiom ‘the higher the price you pay, the lower your return, Callum Thomas estimates the return to investors from the S&P 500 over the next five to 10 years will be somewhere near minus five per cent per annum on average. Better returns are expected to be generated by investing in emerging market equities, commodities, credit, U.S. treasuries and even cash.
He writes “Overall, the market continues to exhibit strong bullish momentum in an uptrend. This has enchanted investors with a sense of euphoria, and as highlighted in this week’s charts, one of the most contrarian moves right now would be switch stocks for bonds… and maybe it’s not the right time just yet, but it sure is contrarian, and the time will come eventually come sooner or later to make that move.”
Indeed, anyone who predicts the equity market will eventually correct is correct. It will. There is always a fallout from a eutrophication of bullish sentiment.
And it’s worth noting there hasn’t been a presidential term in the U.S. where the market hasn’t had a drawdown. Indeed, since 1901, there have only been three presidential terms (all Democrats) where the market pulled back less than 10 per cent. In all other presidential terms, the market fell by double digits at some stage.
As an aside, in January 2016, Deutsche Bank’s Ross Sandler described sentiment at the time towards Amazon shares as euphoric ahead of their Q4 earnings. That was when the shares were trading at US$29. Today, they trade at $226.00.
More recently, the Levkovich Index or the panic/ euphoria model “is now in euphoria, driven by rising margin debt, flat S&P 500 skew, elevated retail surveys, and above average TRF volumes. Elevated sentiment is a risk from here.”
The only problem is that view was offered by Citi’s U.S. equity strategist on 29 March this year. The S&P 500 is 15 per cent higher today and Nvidia (NASDAQ:NVDA) is up 54 per cent (an extreme example, granted).
Most recently, Citi was quoted by Morningstar saying, “high valuations can’t be blamed on big tech’s “Magnificent 7,” despite [their] large weightings, as “it is the other 493 that are trading at their highest forward P/E on a 20-year lookback relative to their own history.”
The purpose of these latter points is not to condemn analysts and commentators. Sentiment at the time may have pushed a share price or index well ahead of what could be justified by expected earnings at the time.
The point instead is that sentiment is fickle and extremely ‘current’. It cares only about the present and may ignore the long-term future. If earnings grow substantially or beyond what was expected or faster than expected, even eutrophic prices today can seem cheap when looking in the rearview mirror sometime in the future.
Finally, if you haven’t already noticed, the Euphoriameter was also at extreme levels in 2017, 2015, 2004, and 1992, and yet the S&P 500 continued rallying for some years.
Today, there’s a conga line of attention-seeking commentators warning of impending doom, or more moderate observers like Thomas, simply highlighting extremely bullish sentiment.
Experience tells me that they will all eventually be correct, but sitting on the sidelines awaiting a crash is a sure way to miss the process of wealth creation through compounding and the retention of profits at high rates of return.
And in any case, predicting rain doesn’t count. Building arks does.