Liquidity, not popularity, is what you should be watching
The frequency of calls that the market is in a euphoric bubble is increasing. It’s worth exploring some of the evidence used to reach that conclusion before deciding whether now is the time to adopt a more cautious stance and to ready oneself for the benefits lower prices deliver.
Notwithstanding the need for more data and analysis to support these claims, we’ll begin by dealing a swift blow to the weakest argument that the market is due for a correction – that it’s risen a lot.
Yes, it is true that stocks in even higher-quality companies like Goodman Group (ASX:GMG), for example, have risen over 60 per cent in the last twelve months. Another high-quality company’s shares, Megaport (ASX:MP1) – a stock owned by the Montgomery Small Companies Fund – have risen by more than 250 per cent in the last year. Even the S&P/ASX200 is up 977 points or 14.4 per cent from its October lows.
Does that mean stocks are now going to fall? Perish the thought! A rising market is insufficiently compelling evidence the market is now due for a correction.
I find this argument difficult to accept as a reason to expect a pullback because it only recognises a rise in price and fails to acknowledge the level from whence that rise came. Were the shares undervalued before they took off, or were they already overpriced to begin with? The same argument also fails to answer whether the shares have now become overpriced on either a relative or absolute basis. Some insights into past or current valuations need to be provided. And remember, even then, prices can remain reflective of exuberance for a long time.
Let’s look at some of the more nuanced arguments.
The first is arguably related to increasing popularity.
The bullish sentiment in the financial markets is undeniably robust. According to the latest data from U.S.-based research firm ETFGI, total assets under management (AUM) for exchange-traded funds (ETFs) globally soared last month to the unprecedented level of U.S.$12.25 trillion. Notably, February marked the 57th consecutive month of net inflows into global ETFs, totalling U.S.$116.3 billion.
Focusing on the asset classes, equity ETFs are the predominant beneficiaries. In February alone, equity ETFs captured net inflows of U.S.$80.4 billion, pushing the year-to-date figure to U.S.$141.4 billion – a nearly sevenfold increase from the corresponding period in the previous year.
Zooming in on the subsectors reaping the benefits of these inflows, the U.S. market, particularly the technology sector, stands out. A prime example is the Vanguard Information Technology ETF (NYSE:VGT), which witnessed a nearly 10 per cent increase in its funds under management to U.S.$70 billion.
Yes, stocks are popular again, or is it ETFs themselves?
According to Grant’s Interest Rate Observer, more than 12,000 ETF products exist worldwide, up 140 per cent from just five years ago. Over the past 15 months alone, as many as 3,000 ETF products have launched, nearly matching the 3,700 companies listed on U.S. exchanges. Is the tail now wagging the dog? That’s a question for another time.
Once again, it’s safe to say stocks are popular.
This is reflected in the expansion of the price-to-earnings (P/E) ratio, which is a proxy for popularity. The higher the P/E, the more popular investing in a stock or the index must be. According to Bloomberg, back in September 2022, at the depths of the last market selloff, the P/E ratio of the S&P/ASX200 was 12.44 times. Today, the P/E ratio is 17.04 times. That shift reflects an improvement in sentiment towards investing in equities that can be at least partly attributed to a more sanguine outlook for interest rates and inflation.
Lest you worry that interest rates aren’t falling fast enough, however, keep in mind the improvement in sentiment has occurred as bond rates have actually risen.
More importantly, while P/Es have risen, they are a far cry from the levels of popularity they reflected during historical periods of euphoria.
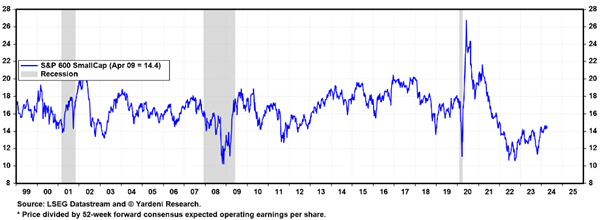
Figure 1. U.S. S&P600 Small Cap Index P/E ratio
 As you can see from Figure 1., which reveals the one-year forward P/E ratio for the U.S. S&P600 small cap index since the turn of the century, the multiple of earnings investors are willing to pay for smaller companies has only been lower after the GFC, during the GFC, and after the tech wreck in the early 2000s. While PE ratios have recently risen, they are nowhere near the levels of euphoria that preceded crashes in the past.
As an aside, the small cap investment universe is one of the most exciting parts of the market in which to invest. You can gain exposure to sectors, industries and themes that simply aren’t available in large caps. Also worth keeping in mind is the small cap universe is always expanding and being refreshed. New companies emerge, there are initial public offerings (IPOs), and all the merger and spinoff activity ensures there’s always an opportunity around the corner for those willing to devote their time to the analysis.
The second and third arguments are like the first: Related to popularity.
According to EPFR Global, investors poured U.S.$56 billion into U.S. equities in the middle week of March. This was a new record, and 39 per cent, or U.S.$22 billion, went into technology stocks. The previous record was in March 2021.
A Bank of America survey of global fund managers reveals the most bullish sentiment since November 2021, proving that those flows reflect popularity.
For me, these arguments are little more than clumsy measures of popularity. They do little to help predict the answer to the more important question of when the market will turn down. To do that, we’d need to measure when sentiment is changing, and we can’t forecast that. All measures of sentiment are coincident at best. The market will already be falling by the time you read measures of popularity are falling.
For what it’s worth, the preponderance of IPOs is one sign that boom conditions are becoming bubble-like. Typically, bubbles are defined by euphoria, which manifests in various ways. One is the proliferation of initial public offerings, and another is the magnitude of first-day price increases for those IPOs.
Investment banks know they must “feed the ducks while they’re quacking”, so they provide a steady stream of selldowns and sellouts when markets are hot and potentially irrational. And when markets are hot and irrational, those that missed out fear further opportunity costs, pushing IPO share prices higher on their first day.
In 1999, when I was working at Merrill Lynch, there was a stunning 470 IPOs in the U.S. and a reported 70 per cent first-day capital gain across all IPOs. I recall there was something like a 90 per cent first-day gain for Nasdaq-listed IPOs.
More recently, there were more than 300 IPOs in 2021 as the market heated up post-pandemic. There was also a lot of liquidity as you will see in a moment. First-day gains averaged more than 30 per cent. We are nowhere near those numbers today. In 2023, there weren’t many more than 50 IPOs, and the first-day average gain was about 10 per cent. The ducks aren’t quacking. Yet.
But the IPO market is waking up to the rise in popularity of equities.
In the U.S. chat platform Reddit (NYSE:RDDT) IPO’d on March 21. Its IPO price of U.S.$34 valued the social media company at U.S.$6.5 billion, but after it listed, the stock climbed to close its first day at $50.44 – a gain of over 48 per cent. And keep in mind Reddit has never made a profit in its 20 years of existence.
A few more of these, and we may indeed be adding to the chorus of those screaming ‘bubble’! I don’t think we’re there yet. Yes, stocks are more popular than they were in the recent past, but they are far from being at the levels of popularity seen in previous bubbles. And even the insider selling by Bezos and Zuckerberg shouldn’t raise eyebrows unless you believe they are prophetic market timers.
Jeff Bezos did sell shares worth U.S.$8.5 billion in February, Meta CEO Mark Zuckerberg sold U.S.$135 million worth of shares in early February, and famed investor Peter Thiel offloaded U.S.$175 million of stock this month. Three big sales do not a winter make.
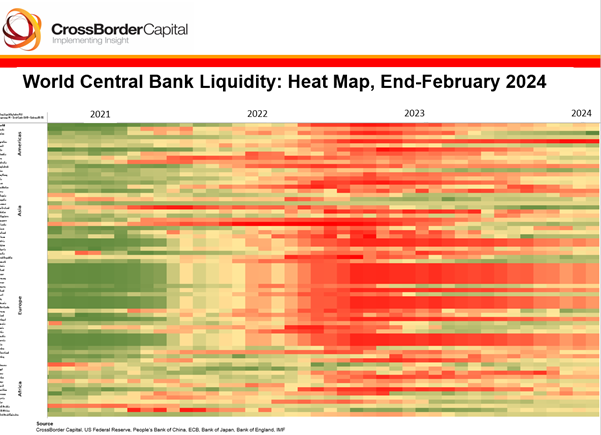
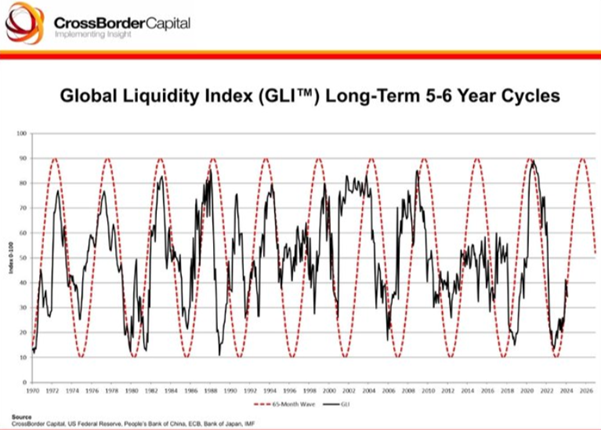
I think it’s prudent to watch liquidity. Liquidity is the main driver of asset prices. Liquidity precedes popularity. Stocks can only become more popular when people have more money (liquidity). And liquidity has been rising since the middle of last year.
Figure 2. CrossBorder Capital liquidity heatmap

Figure 2., and figure 3., shows how more liquidity in 2021 (green in figure 2.) coincided and preceded a rally in markets, while a tightening of liquidity (red) coincided or even preceded the sell-off in equities of 2022. Today’s neutral shade suggests an improvement from 2023, which was positive for equities.
Figure 3. CrossBorder’s global liquidity cycle chart

And keep in mind even though rate cuts might be delayed, there is general acceptance that rates have peaked.
There will be bumps along the way, and nothing in the above discussion suggests the market won’t decline, but most of the so-called ‘signs’ the market is euphoric and therefore primed for something catastrophic appear premature.