Employment statistics – nothing to see here…
If you feel like you’ve been working longer hours of late, you’re not alone. Data just released by the Australian Bureau of Statistics (ABS) show that everyday Australians are needing to pedal harder just to stay still, as they try to battle stagnant wages growth, rising asset prices and falling cash rates.
The ABS recently released its key data around employment for June 2019, and at first glance it appears there is nothing too out of the ordinary around the headline figures, as below:
- Total employment was up 2.6 per cent, 0.6 per cent above its 20-year average of 2.0 per cent;
- Unemployment was down 1.6 per cent, remaining steady at 5.2 per cent;
- Both unemployment and underemployment were down, similarly remaining steady at 5.2 per cent and 8.3 per cent respectively, and;
- Participation rate stayed high at 66.0 per cent.
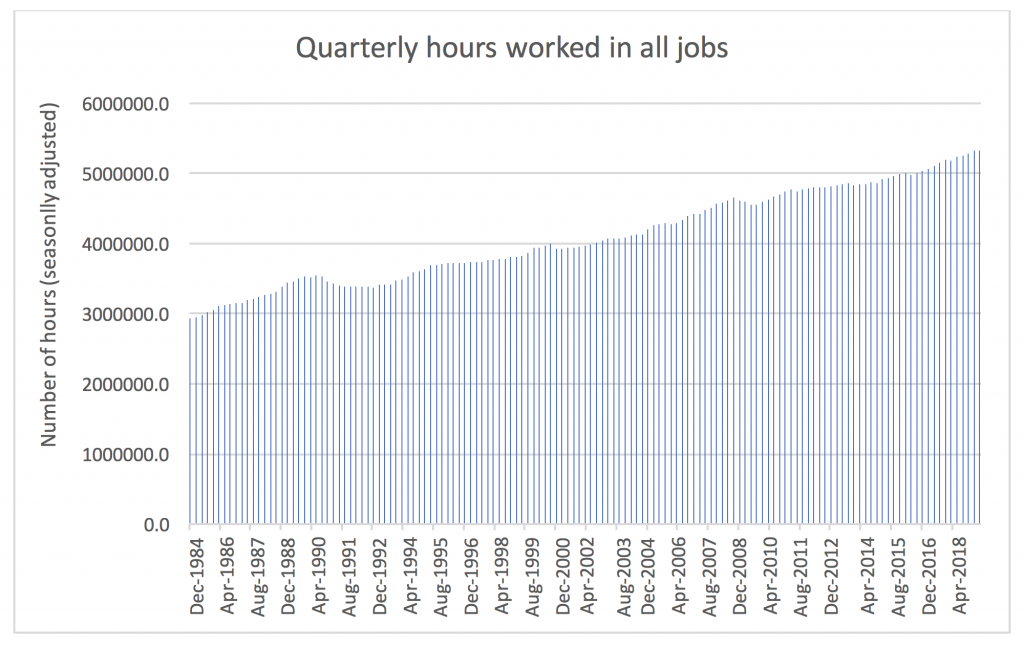
However, if you dig a little deeper, there are two key indicators which show that times are a little tougher for the everyday Australian. The first is that Australians are again working longer hours. For June 2019, monthly hours worked in all jobs was up 2.0 per cent year-on-year which is still above the 20-year average of 1.7 per cent. On a longer-term basis, the number of hours worked in all jobs is as below:
Source: ABS
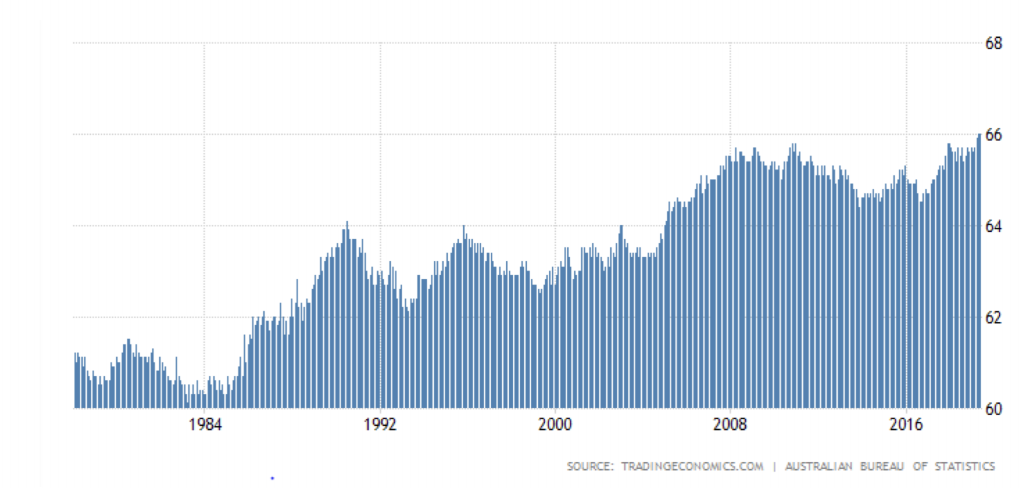
Secondly, in the fine print in the headline data is the participation rate at 66 per cent being at an all-time high, as below. The participation rate “is the number of persons who are employed and unemployed but looking for a job divided by the total working-age population.”
Accompanied with low unemployment, it is not a stretch to think the everyday Australian has been forced to seek employment for longer periods of time to combat rising asset prices, lower returns from cash (which particularly affects retirees), higher costs of living and lower wage inflation.
Source: Trading Economics
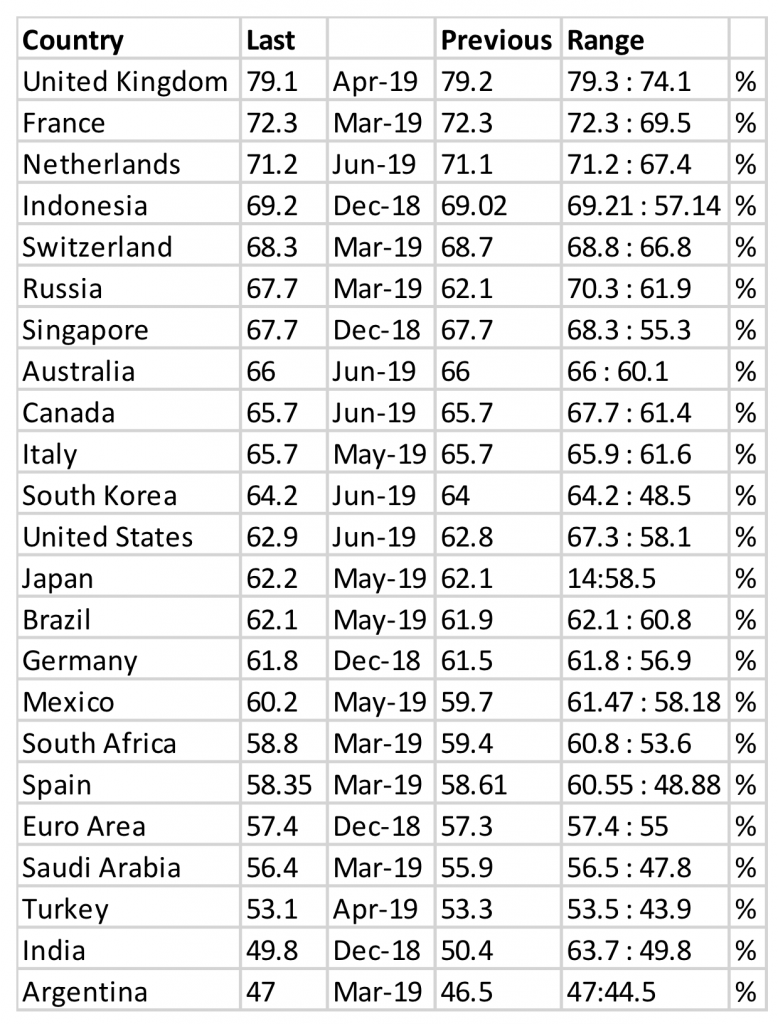
On a geographic basis, Australia still has a lower participation rate than some of the more developed G20 peers in the United Kingdom and a few notable European counterparts (see the following table). Does this mean we still have further to go?
If you look to my parents, as an example, my father is 63 and still works full-time in a corporate role and is showing no signs of retiring anytime soon. My mother at 60 is still a school teacher and my father would like to think she can still work until she is 75!
Indeed, the new interest rate paradigm will have real-world consequences, with some easier to measure and identify than others.
Source: Trading Economics
Do you feel like you’ve been working longer hours lately? You’re not alone, as shown by recent data from the ABS. Share on X


Luke Joseph
:
Dean just curious about what you mean when you say that the UK and some European countries are “more developed” than Australia?
Dean Curnow
:
Hi Luke, the comment is more in relation to the G20 peer group which includes both developed and emerging economies. Of which, the comparison was directed to the developed economies that sit within the G20 collective. Kind regards, Dean Curnow.
Anthony Fox
:
With all due respect, I think this article ignores the actual facts.
AVERAGE HOURS PER WORKER* in Australia has been steadily FALLING since the GFC. Total hours worked is going up due to the truly massive immigration and foreign labour program. With this labour supply shock, further deregulation of the labour market and growth of insecure employment, average hours per worker will continue to fall.
*Refer chart included in the RBA Chart Pack – https://www.rba.gov.au/chart-pack/pdf/chart-pack.pdf?v=2019-07-23-10-05-56. Data table – https://www.rba.gov.au/statistics/tables/xls/h05hist.xls?v=2019-07-23-09-59-47.
Dean Curnow
:
Hi Anthony, thanks for your comment. You are correct in that whilst total hours worked has steadily increased, the average hours worked since the GFC has steadily declined. I have graphed this from the ABS raw data for anyone that is interested in viewing below. Interestingly, on a longer term basis both full-time and part-time average hours worked has generally increased (noting that part-time workers now make up about a third of the total workforce). Key to long term labour demand has been the shift to more service oriented business models, the desire for more flexible work arrangements and also due to the changing makeup of the workforce itself from a gender and age perspective. For those interested, you can also read more about these trends below.
Average hours worked – https://rogermontgomery.com/wp-content/uploads/2019/07/image.png
Trends in working hours – https://www.abs.gov.au/ausstats/abs@.nsf/featurearticlesbytitle/67AB5016DD143FA6CA2578680014A9D9?OpenDocument, and;
https://www.rba.gov.au/publications/bulletin/2017/sep/pdf/bu-0917-3-the-rising-share-of-part-time-employment.pdf
Kind regards, Dean Curnow.