Is the market cheap or expensive?
Recently, our friends at AMP capital released a note suggesting the market might not be expensive.
In the 28 April article entitled “Where are we in the investment cycle” the author writes;
“So the big question is: are we at or near “exhaustion” for the cyclical bull market in shares? The best way to look at this is to assess market valuation, economic growth and inflation pressures, monetary conditions and investor sentiment.”
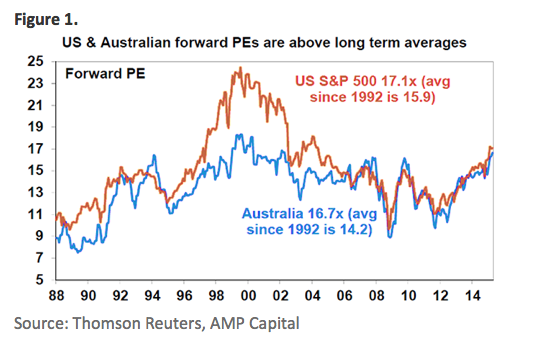
Share market valuations are mostly okay. Sure, measured in isolation against their own history shares are no longer dirt cheap. In fact, forward price to earnings multiples in the US and Australia are above long term averages. [see Figure 1.]
However, once the gap between share market earnings yields and bond yields is allowed for, shares still look cheap. [Figure 2.]

To suggest that shares might still be cheap, AMP have cited (see Figure 2.) a derivative of a model known as the “Fed Model”. By comparing the stock market’s one-year forward earnings yield (E/P) to the yield on 10-year Treasury notes, the Fed Model states that bond and stock markets are in equilibrium, and fairly valued, when the earnings yield equals the bond yield.
According to those who attribute some predictive power to the Fed Model, if the equity earnings yield is above the government bond yield, investors would benefit by shifting funds from bonds to equities.
By way of background, the Fed Model was so named by Ed Yardeni, at Deutsche Morgan Grenfell, based on a statement made by the US Federal Reserve in the Humphrey-Hawkins report of July 22, 1997 that warned:
“…changes in this ratio [P/E of the S&P 500 index] have often been inversely related to changes in the long-term Treasury yields, but this year’s stock price gains were not matched by a significant net decline in interest rates. As a result, the yield on ten-year Treasury notes now exceeds the ratio of twelve-month-ahead earnings to prices by the largest amount since 1991, when earnings were depressed by the economic slowdown.”
In other words, in 1997, Treasury yields were higher than the equity earnings yield. According to the Fed Model, investors would benefit in 1997 by shifting funds from equities to bonds. In July 1997 the S&P500 traded at 930 points. By July of 1999 however the S&P had traded at more than 1400 points – a 50 per cent return over 2 years. This compares to a total return for US10Yr Treasuries of 7 per cent[1].
Interesting.
According to Clifford S. Asness from AQR Capital Management, LLC, in his 2002 Paper entitled, Fight the Fed Model: The Relationship Between Stock Market Yields, Bond Market Yields, and Future Returns;
“The “Fed Model” has become a very popular yardstick for judging whether the U.S. stock market is fairly valued. The Fed Model compares the stock market’s earnings yield (E/P) to the yield on long-term government bonds. In contrast, traditional methods evaluate the stock market purely on its own without regard to the level of interest rates. My goal is to examine the theoretical soundness, and empirical power for forecasting stock returns, of both the “Fed Model” and the “Traditional Model”. The logic most often cited in support of the Fed Model is that stocks should yield less and cost more when bond yields are low, as stocks and bonds are competing assets. Unfortunately, this reasoning compares a real number to a nominal number, ignoring the fact that over the long-term companies’ nominal earnings should, and generally do, move in tandem with inflation. In other words, while it is a very popular metric, there are serious theoretical flaws in the Fed Model. Empirical results support this conclusion. The crucible for testing a valuation indicator is how well it forecasts long-term returns, and the Fed Model fails this test, while the Traditional Model has strong forecasting power. Long-term expected real stock returns are low when starting P/Es are high and vice versa, regardless of starting nominal interest rates. I also examine the usefulness of the Fed Model for explaining how investors set stock market P/Es. That is, does the market contemporaneously set P/Es higher when interest rates are lower? Note the difference between testing whether the Fed Model makes economic sense, and thus forecasts future long-term returns, versus testing whether it explains how investors set current P/Es. If investors consistently confuse the real and nominal, high P/Es will indeed be contemporaneously explained by low nominal interest rates, but these high P/Es lead to low future returns regardless. I confirm that investors have indeed historically required a higher stock market P/E when nominal interest rates have been lower and vice versa. In addition, I show that this relationship is somewhat more complicated than described by the simple Fed Model, varying systematically with perceptions of long-term stock and bond market risk. This addition of perceived risk to the Fed Model also fully explains the previously puzzling fact that stocks “out yielded” bonds for the first half of the 20th century, but have “under yielded” bonds for the last 40 years. Finally, I note that as of the writing of this paper, the stock market’s P/E (based on trend earnings) is still very high versus history. A major underpinning of bullish pundits’ defense of this high valuation is the Fed Model I discredit. Sadly, the Fed Model perhaps offers a contemporaneous explanation of why P/Es are high, but no true solace for long-term investors.”
On page four of the paper Asness observes: “While the Fed Model fails as a predictive tool for future long-term stock returns, I find more success for it as a descriptive tool for how investors choose to set E/Ps. Applying a relationship studied in Bernstein [1997, 2002] and Asness [2000] I show that investors do in fact set current E/Ps as a direct function of nominal interest rates. However, the relationship is subtle, as it must be conditioned on the perceived volatility of stocks and bonds. Without conditioning on perceived volatility, the simple Fed Model is a failure, even for only description, over 1926-2001. On the other hand, with conditioning on volatility, the Fed Model cleanly explains the puzzle of why the relative yield on stocks and bonds has varied so greatly over the last century.”
“Note the seeming contradiction, and potential confusion, in my assertions. I first argue that the Fed Model is theoretically flawed amd, consistent with this, is a poor forecaster of of long-term future stock returns. I then turn around and argue that the Fed Model, if properly adjusted for changing perceptions of stock and bond market risk, is a powerful descriptive tool for how investors actually set stock market P/Es….I show that investors do contemporaneously set P/Es based on nominal interest rates (the Fed Model as explanatory tool). However, I argue that they most probably do so in error, largely because the consistently confuse the real and the nominal…Because they do so in error it is not a contradiction but follows quite naturally that the Fed Model is a poor forecaster of stock returns.”
In essence, this suggests that AMP’s view – that the market is not expensive and might actually be reasonably cheap – could be completely wrong.
We believe it is essential when valuing companies and markets, to do so without reference to price. That means removing all inputs that are price related. Price/Earnings ratios, earnings yields and PEG (Price earnings growth) ratios, form no part of the valuation equation. Whether a business is listed or unlisted it can and should be valued without reference to the stock market.
Our own valuation approach suggests the market is in fact about ten per cent overpriced. In other words it IS expensive. What is important to note is that in the past, a ten per cent overpricing by the market has not preceded an imminent correction. The market has been more expensive in the past than it is now and has remained expensive for longer periods than it has recently. Having said that, the fact remains that periods of exuberance are always followed by periods of despondency.
[1] Mark Todd, MD NAB Fixed Interest
Roger Montgomery is the founder and Chief Investment Officer of Montgomery Investment Management. To invest with Montgomery, find out more.
Roger Montgomery is the Founder and Chairman of Montgomery Investment Management. Roger has over three decades of experience in funds management and related activities, including equities analysis, equity and derivatives strategy, trading and stockbroking. Prior to establishing Montgomery, Roger held positions at Ord Minnett Jardine Fleming, BT (Australia) Limited and Merrill Lynch.
He is also author of best-selling investment guide-book for the stock market, Value.able – how to value the best stocks and buy them for less than they are worth.
Roger appears regularly on television and radio, and in the press, including ABC radio and TV, The Australian and Ausbiz. View upcoming media appearances.
This post was contributed by a representative of Montgomery Investment Management Pty Limited (AFSL No. 354564). The principal purpose of this post is to provide factual information and not provide financial product advice. Additionally, the information provided is not intended to provide any recommendation or opinion about any financial product. Any commentary and statements of opinion however may contain general advice only that is prepared without taking into account your personal objectives, financial circumstances or needs. Because of this, before acting on any of the information provided, you should always consider its appropriateness in light of your personal objectives, financial circumstances and needs and should consider seeking independent advice from a financial advisor if necessary before making any decisions. This post specifically excludes personal advice.
Great article, I’ve never used the Fed Model before, the deficiencies seem quite obvious. Always appreciate Asness’ analysis of an issue though, his research is some of the most relevant and interesting I’ve found without paying for it.
Curious if you’ve read the recent paper he posted called Fact, Fiction and Value Investing? It was interesting to see my preconceptions around value and quality were confirmed, however the effectiveness of momentum was surprising to me. I’ve always avoid momentum investing in all forms as I view it as antithetical to value investing, but from what they’ve found it seems to have significance – at least in the context of a quant fund such as AQR. Not sure I’d be keen to incorporate it into my own process at this stage, however I do intend to consider it as a factor for my research project in my final year.
Link in case you haven’t seen it:
https://www.aqr.com/library/working-papers/fact-fiction-and-value-investing
Our research has also identified some unusual factors that have explanatory power and are therefore in our filtering process.
This seems like some pretty lazy stuff from AMP. If you need to find a valuation on US Shares you should be using a model that takes them and them alone into account (like CAPE, Tobins Q the Warren Buffett Indicator. Comparing there artificially boosted yields to bonds, which many people already believe are deep in a bubble, is just shoddy work.
Also, the time period they have used for the PE Study is very recent and includes a lot of periods of Fed Easing which have arguably never let busts finish as low as they needed to and clean out the system properly. This may well be seen next time the US economy dives and there is no more easing powder left in the barrel.
Neither the Fed Model nor the models I mentioned are short-term timing tools, however, for what I do choose to take on board from these sorts of indicators, I will take from the share-market based tools (showing extreme valuation) and leave the Fed Model to those who want to believe that this time it’s different this time.
Nicely articulated Guy. Q might arguably be skewed by the difficulty in measuring replacement cost for IT/Social Media businesses that currently dominate the landscape. One could however also argue that they are therefore in a bubble too.
Agree Roger. Whilst i was never interested in Twitter, i have valued it now a couple of times and each time they were serverley overvalued. Even when you account for the difficulties in valuing such a company, it was hard to see how the growth would ever eventuate. I imagine more robust social media companies like facebook would be similar.
Add to the mix companies like Instagram that Facebook paid over a billion for. Not only did they have no revenue, they had no revenue model!
That is a very interesting point Roger. I just went back to the Q chart and by far it’s highest historical point was in the other market dominated by IT businesses- the techwreck, which peaked at 1.64x. We are now at 1.11x, which is the second highest period on record, so maybe this does indicate a tendency to spike in IT featured markets. Unfortunately, in 2000 and now, it is these types of companies that can tend to be unprofitable at the IPO stage and so currently we have the highest number of unprofitable IPOs in US history.
Another interesting point from the chart is that the long-term mean is .68 and (coincidentally from my comments before about 1992 as a start point) the Q Ratio passed this point in 1992 and has only been back below it once, during the GFC when it reached .57 at trough. Cyclical bottoms prior to this included 4 times between 1920 and 1990 where the ratio bottomed out at between .28 and .32. In fact if you wanted to take the least historically indicative part of the Q Chart, it would be 1992-present.
Many proven value investors (Klarman, Grantham, Marks, Montier etc.) now seem to agree that a crash will bookend this period of the market we are currently in, it is just the timing of when that is unclear (and I guess as value investors they should know how futile market-timing is) and if this viewpoint proves correct, it would be scary to think the result if the Q corrected to it’s earlier cyclical low level of around .3. I guess that would leave the S&P 500 at around 563. Probably not likely to happen, but a number that’s probably worth being aware of as a possibility, if you are going to hold through this cycle. Sounds a little pessimistic, however a great man once said to be fearful when others are greedy and greedy when others are fearful.
I hope they’re right. We have a lot of cash ready to go.
Great article Roger. I have been reflecting on this recently myself. AMP’s article seems to have been written in accordance with the very basic Capital Asset Pricing Model (CAPM). This model implies that the required return on equity should decline as risk free rates decline. In other words, as bond yields lower, stocks should become more expensive and P/Es should increase.
I personally think that this is quite dangerous, as bond yields are out of an investor’s control. By justifying a high P/E on this basis, this assumes that bond yields will stay low indefinitely which is a highly risky proposition. The very fact that earnings yields are correlated with bond yields to some extent means that you need to look through the cycle if you want to deliver returns which are not perfectly correlated with the broader index (ie generate outperformance).
“as bond yields are out of an investor’s control”. Indeed Aditya! That is why our valuations have no derivative of price as an input.
Interestingly John Hussman commented on this issue over the weekend, mentioning the Fed Model in particular as only having a .48 correlation with actual future returns. This contrasts to the P/R at .89, Warren Buffett Indicator at .88, Shiller PE adjusted for profit margin .88 and Tobin’s Q .85. Shockingly to many, although not yourself I know Roger, Price/Forward Earnings is only a .79 correlation.
I don’t know how aware of Hussman you are but he was a stellar perfomer for a couple of decades, until he incorrectly tipped the market to go much lower in 2009 and has been calling the market over-valued and missed a lot of returns since then. Still he is clearly a clever economist/mathematician and I wouldn’t doubt these numbers he has produced.
You would have noted Warren Buffett’s comments on the market being “too high if rate’s were normal” as well. But as you say, rate’s rising in the US again seems further away than ever at present. As always, I’ll be watching with interest.
Great summary Guy. Thanks.