Spiralling debt is pouring fuel on investor anxieties
These days, it’s not easy for investors to feel relaxed and comfortable. Pouring more fuel on investor anxieties is a report by the Bank of International Settlement that shows global debt spiralling out of control.
Based on their recently released survey, the Bank of International Settlement’s chief economist, Claudio Borio, said there were ample reasons to worry about the health of the world’s financial system. Zero interest rates and bond purchases by central banks have left markets acutely sensitive to the slightest shift in monetary policy, or even a hint of a shift.
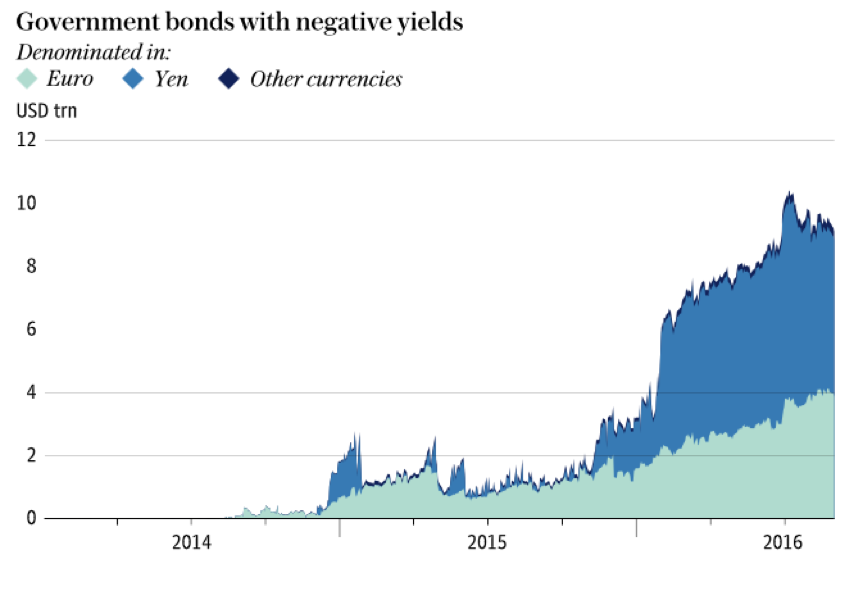
The historical anomaly of negative interest rates being offered for so much sovereign debt, and now spreading to corporate debt, is underpinning highly valued stock markets at a time when profit growth is more difficult to come by.
 Of significance, China’s total credit to GDP hit 255 per cent at the end of the March 2016 Quarter, up 70 per cent in five years, the biggest jump of any country in the survey. (Australia was up by 47 per cent to 247 per cent of GDP). China’s outstanding loans of US$28 trillion, is as much as the commercial banking systems of the US and Japan combined. Of this, corporate debt accounts for US$18.8 trillion or 171 per cent of GDP, and this figure is keeping the global regulators awake at night.
A recent article in China’s state-owned People’s Daily warned their debt had been “growing like a tree in the air” and it is time to accept that China cannot continue to “force economic growth by levering up” and that the country must take its punishment.
Total Credit to the Non-financial Sector (core debt), % of GDP (BIS data)
| Country | 2010 | Q1 2016 | Change |
| Argentina | 57.4 | 69.0 | 11.6 |
| Australia | 200.0 | 247.2 | 47.2 |
| Austria | 235.9 | 241.7 | 5.8 |
| Belgium | 291.6 | 360.2 | 68.6 |
| Brazil | 118.2 | 146.3 | 28.1 |
| Canada | 253.3 | 287.3 | 34.0 |
| Chile | 117.6 | 169.9 | 52.3 |
| China | 184.4 | 254.9 | 70.5 |
| Czech Republic | 122.1 | 133.6 | 11.5 |
| Denmark | 302.8 | 282.2 | -20.6 |
| Finland | 219.1 | 254.9 | 35.8 |
| France | 252.4 | 293.6 | 41.2 |
| Germany | 198.9 | 185.2 | -13.7 |
| Greece | 246.0 | 296.2 | 50.2 |
| Hong Kong | 222.8 | 282.5 | 59.7 |
| Hungary | 215.9 | 194.0 | -21.9 |
| India | 127.0 | 129.5 | 2.5 |
| Indonesia | 51.5 | 66.1 | 14.6 |
| Ireland | 399.1 | 405.3 | 6.2 |
| Israel | 199.2 | 182.0 | -17.2 |
| Italy | 244.5 | 276.8 | 32.3 |
| Japan | 351.9 | 393.6 | 41.7 |
| Korea | 204.6 | 237.0 | 32.4 |
| Luxembourg | 418.5 | 429.5 | 11.0 |
| Malaysia | 169.5 | 190.4 | 20.9 |
| Mexico | 57.0 | 78.1 | 21.1 |
| Netherlands | 307.1 | 309.8 | 2.7 |
| New Zealand | 207.6 | 208.3 | 0.7 |
| Norway | 268.4 | 274.2 | 5.8 |
| Poland | 126.4 | 136.0 | 9.6 |
| Russia | 63.8 | 88.8 | 25.0 |
| Saudi Arabia | 54.7 | 74.4 | 19.7 |
| Singapore | 205.0 | 251.6 | 46.6 |
| South Africa | 106.3 | 125.8 | 19.5 |
| Spain | 275.2 | 283.0 | 7.8 |
| Sweden | 262.5 | 276.2 | 13.7 |
| Switzerland | 227.5 | 245.6 | 18.1 |
| Thailand | 123.2 | 154.5 | 31.3 |
| Turkey | 95.6 | 110.5 | 14.9 |
| United Kingdom | 262.5 | 266.0 | 3.5 |
| United States | 247.3 | 252.5 | 5.2 |
| All Countries | 227.9 | 245.3 | 17.4 |
| Developed Countries | 269.3 | 279.3 | 10.0 |
| Emerging Countries | 138.7 | 186.6 | 47.9 |