Investment platforms: more than just an admin tool
Investment platforms are many things, from an administration tool for advisers and the end investor, to a world of wrapped investment options only previously presented to SMSF’s with both strong paperwork skills and large balances.
What they are also is growing, both by the number of offerings and the evolving services they offer. Rainmaker, in their most recent Advantage report to 30 March 2020, explored some of the trends we have long-observed in the Australian investment platform market. These include the growth of non-bank owned platforms, and within these offerings, the continued rise of managed accounts. I have summarised some of the key findings from this report, which continue to have implications on the intermediary market and moreover the financial services industry in Australia.
According to Rainmaker, the total assets in the Australian investment platform market to 30 March 2020 was $680 billion. This represented positive growth for the March quarter of 8 per cent, however negative growth for the year of -3 per cent.
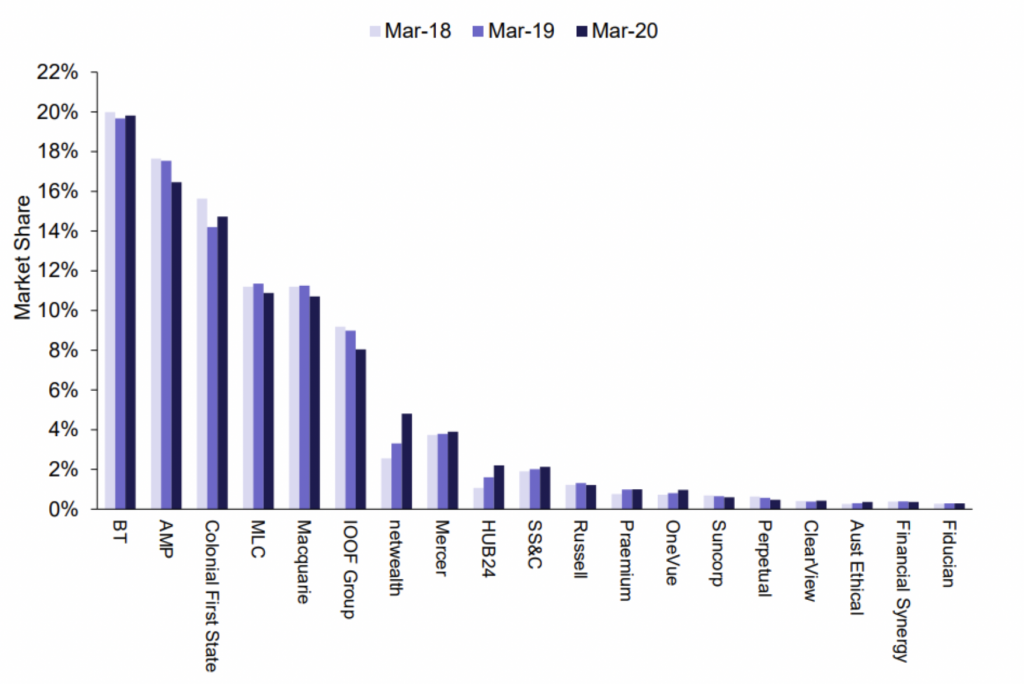
The bank-owned incumbents still dominate the total assets held as captured in Graph 1.
Graph 1: Largest groups administering platforms
Source: Rainmaker
BT across its platform suite accounts for 20 per cent of the market, closely followed by AMP (16 per cent) and Colonial First State (15 per cent). However, the incumbents’ market shares is not growing. BT, AMP, Colonial, MLC and IOOF have all not grown their market share in the last two years. Why is this? Partly because of the maturity of their platform books and exposure to retirees versus accumulators, but additionally due to the emergence of non-bank incumbents and the technology and functionality they bring to the market by virtue of their smaller size and scale. Consequently, ASX listed Netwealth and HUB24 have almost doubled their market share over the last two years, and yet still represent a smaller amount of the overall market.
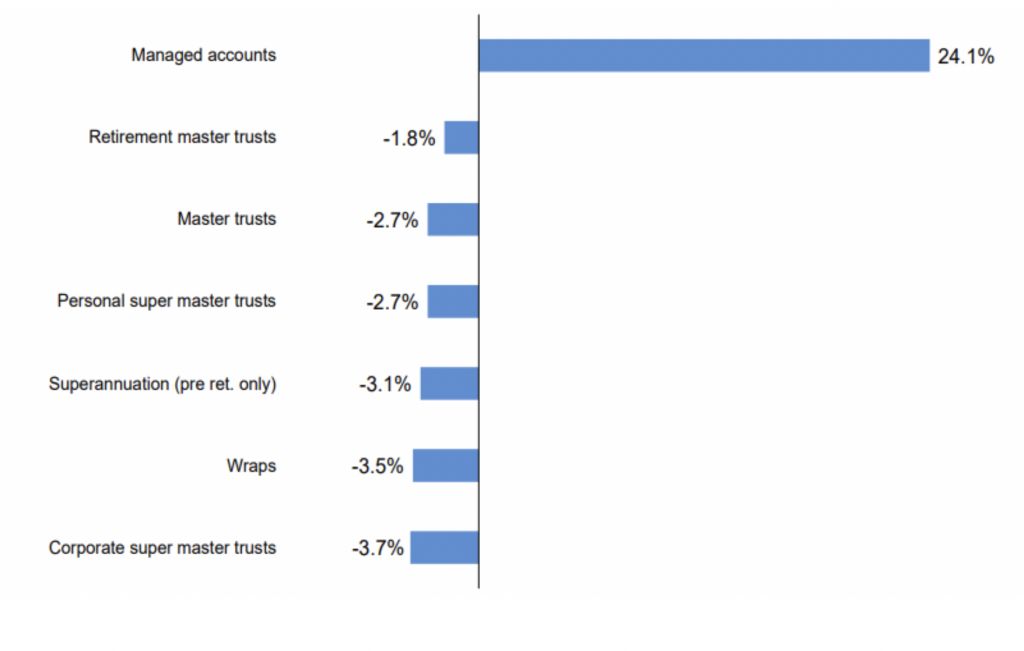
A key part of the success of the likes of Netwealth and HUB24 has been their expertise and complementary functionality around managed accounts. In fact, as captured by Graph 2, in dissecting the growth of platforms over the last 12 months managed accounts have, not surprisingly, been doing all the heavy lifting. Moreover, managed accounts now amass $65 billion in assets as of 30 March according to Rainmaker. If you want to read more about managed accounts, please see my article Managed accounts: What’s all the fuss about?
Graph 2 – Platform FUA growth – over last 12 months, March 2020
Source: Rainmaker
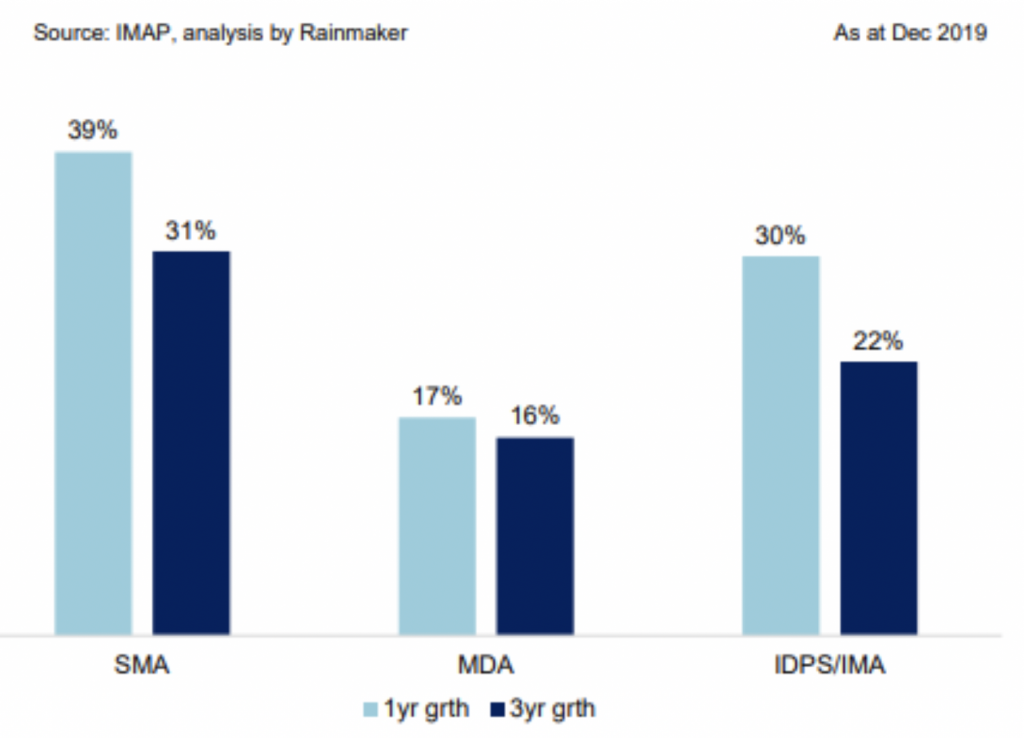
The Institute of Managed Account Professionals (IMAP) breaks down managed accounts into three segments shown in Graph 3:
- Separately Managed Accounts (SMAs) which accounted for 39 per cent of the growth in managed accounts as at the end of 2019
- Individually Managed Accounts (IMAs) at 30 per cent and,
- Managed Discretionary Accounts (MDAs) at 17 per cent of total growth respectively.
Although MDAs still account for the largest asset share of managed accounts at 37 per cent as at the end of 2019, it is not hard to envisage over time that SMAs will surpass MDAs given their current growth trajectories and the regulatory restrictions imposed upon MDAs and their use by ASIC in recent years.
Graph 3 – Managed account segment type growth rates
Source: Rainmaker
Managed accounts have now evolved by the assets and type of investments they can incorporate to include any combination of managed funds, Exchanged Traded Products and SMAs. To date, the skew of managed accounts has been heavily weighted towards multi-asset or diversified solutions, accounting for about half of the strategies on offer, followed by single sector equity capabilities at 41 per cent and other asset classes such as property and bonds at roughly 10 per cent.
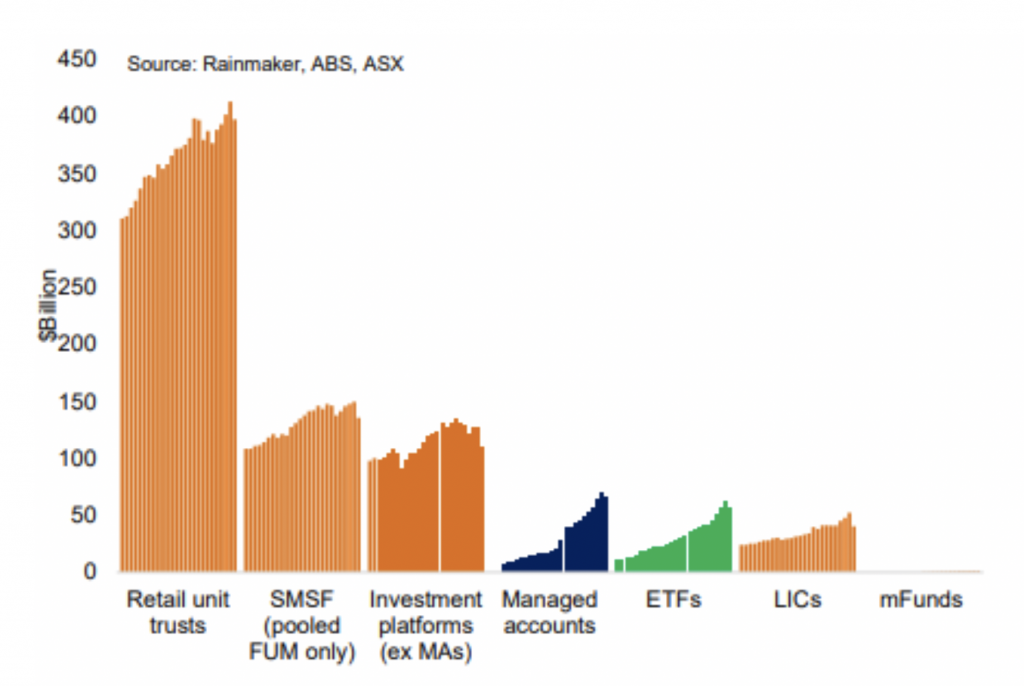
There is importantly one challenger to the growth in managed accounts. Exchanged Traded Products do not need to be facilitated via a platform (as such avoiding an administration cost) and can be accessed direct to market. This segment alongside managed accounts was the fastest growing wholesale, or non-retail segments, over the last few years. Like any new technology, continued innovation and growth is key in the investment platform market and as such it will be interesting to see how this race plays out in the years to come.
Graph 4 – Non-super retail FUA 2013-20
Source: Rainmaker


