
How do we calculate total returns?
This blog provides investors with an explanation of how total return figures are calculated for the Montgomery Small Companies Fund. Importantly it is worth knowing the investment returns are not generated by Montgomery Investment Management. Fundhost Limited is the Independent Administrator and Responsible Entity of the Montgomery and Polen Capital Funds and is responsible for all the calculations.
When we discuss the returns of our Funds one of the questions that invariably arise is; how do we arrive at the total return figure?
The frequency of the question suggests that it’s a mystery to many of our investors, so this blog is designed to help you understand the figures we report.
Fundhost applies conventional industry practice in the calculation of the total investment returns, which must accurately reflect the returns generated by the Funds.
At 31 August 2023, the total return of the Montgomery Small Companies Fund since inception (20 September 2019) was 34.15 per cent and the unit price was $1.2299. The question we are seeking to answer is how the total return (after expenses) can be 34.15 per cent if the unit price, which commenced its life at $1.00 is, at the same time, $1.2299.
In short, the answer is contained in the distributions from the Fund and how they are treated. For the total return calculation, all distributed income is assumed to be reinvested back into the Fund.
The treatment is standard practice and measures the return of an investor who invested $1.00 at the inception of the Fund (20 September 2019) and then selected the reinvestment option for their distributions – buying additional units with their distributions rather than receiving them as cash.
Importantly, this treatment ensures you are measuring apples with apples when comparing the returns of a fund to an accumulation benchmark. The Montgomery Small Companies Fund’s benchmark is the S&P/ ASX Small Ordinaries Accumulation Index, and the calculation of the index each day also assumes the reinvestment of all dividends.
If an investor had invested $100,000 in the Montgomery Small Companies Fund at inception and reinvests all distributions back into the Montgomery Small Companies Fund whenever they are received their investment would have grown to $134,149 by the end of August 2023.
To compare “apples with apples” the figures behind total returns and any accumulation index assumes that investors reinvest distributions/dividends.
So, the difference between the unit price of $1.2299, or the net asset value of the Montgomery Small Companies Fund at 31 August 2023, and the total return of $1.3415 between the inception date of 20 September 2019 and 31 August 2023, essentially comes down to whether the distributions are reinvested or not.
Finally, and as we noted earlier, even our benchmark the S&P/ASX Small Ordinaries Accumulation Index assumes that all dividends paid are reinvested. Hence when comparing the investment performance with the Montgomery Small Companies Fund it is assumed all distributions are reinvested.
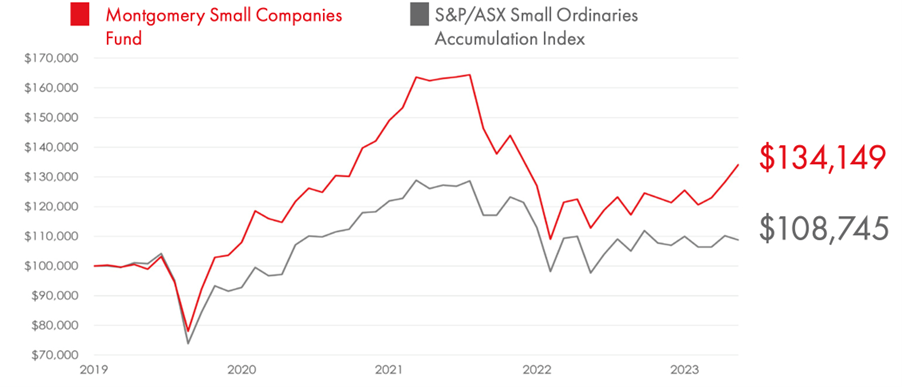
You can see the outperformance below where we’ve compared the hypothetical performance of a $100,000 investment in the Montgomery Small Companies Fund, where the investor has elected to reinvest all distributions, compared with a $100,000 investment in the S&P/ ASX Small Ordinaries Accumulation Index over the same time frame.
Montgomery Small Companies Fund performance (distributions reinvested) to 31 August 2023
 Source: Fundhost
The Montgomery Small Companies Fund investor has grown his account to $134,149 by 31 August 2023, whereas the Index investor has grown his account to a total of $108,745.
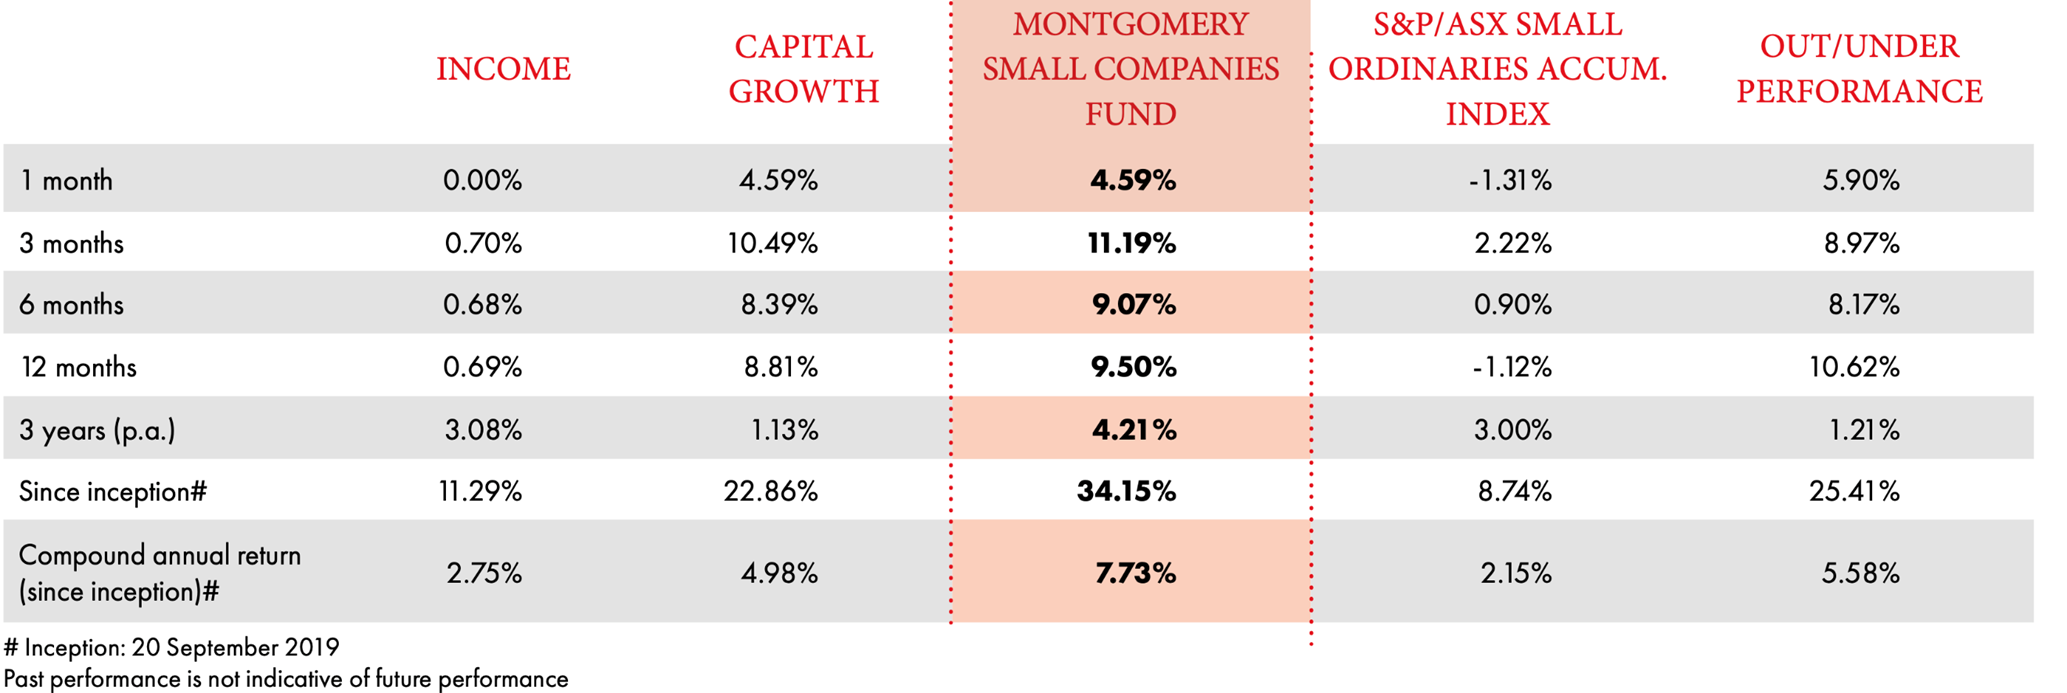
The total returns (after expenses) to 31 August 2023
What is the S&P/ ASX Small Ordinaries Accumulation Index?
The Index includes Australia’s largest 101 to 300 largest securities by float-adjusted market capitalisation.
At 31 August 2023, the Small Ordinaries Index had a market capitalisation of $343 billion, accounting for 13 per cent of the broader All Ordinaries Index, which comprises up to 500 securities, with a market capitalisation of $2.58 trillion. The top 100 companies, which have a market capitalisation of $2.14 trillion, accounting for 83 per cent of the All Ordinaries Index.
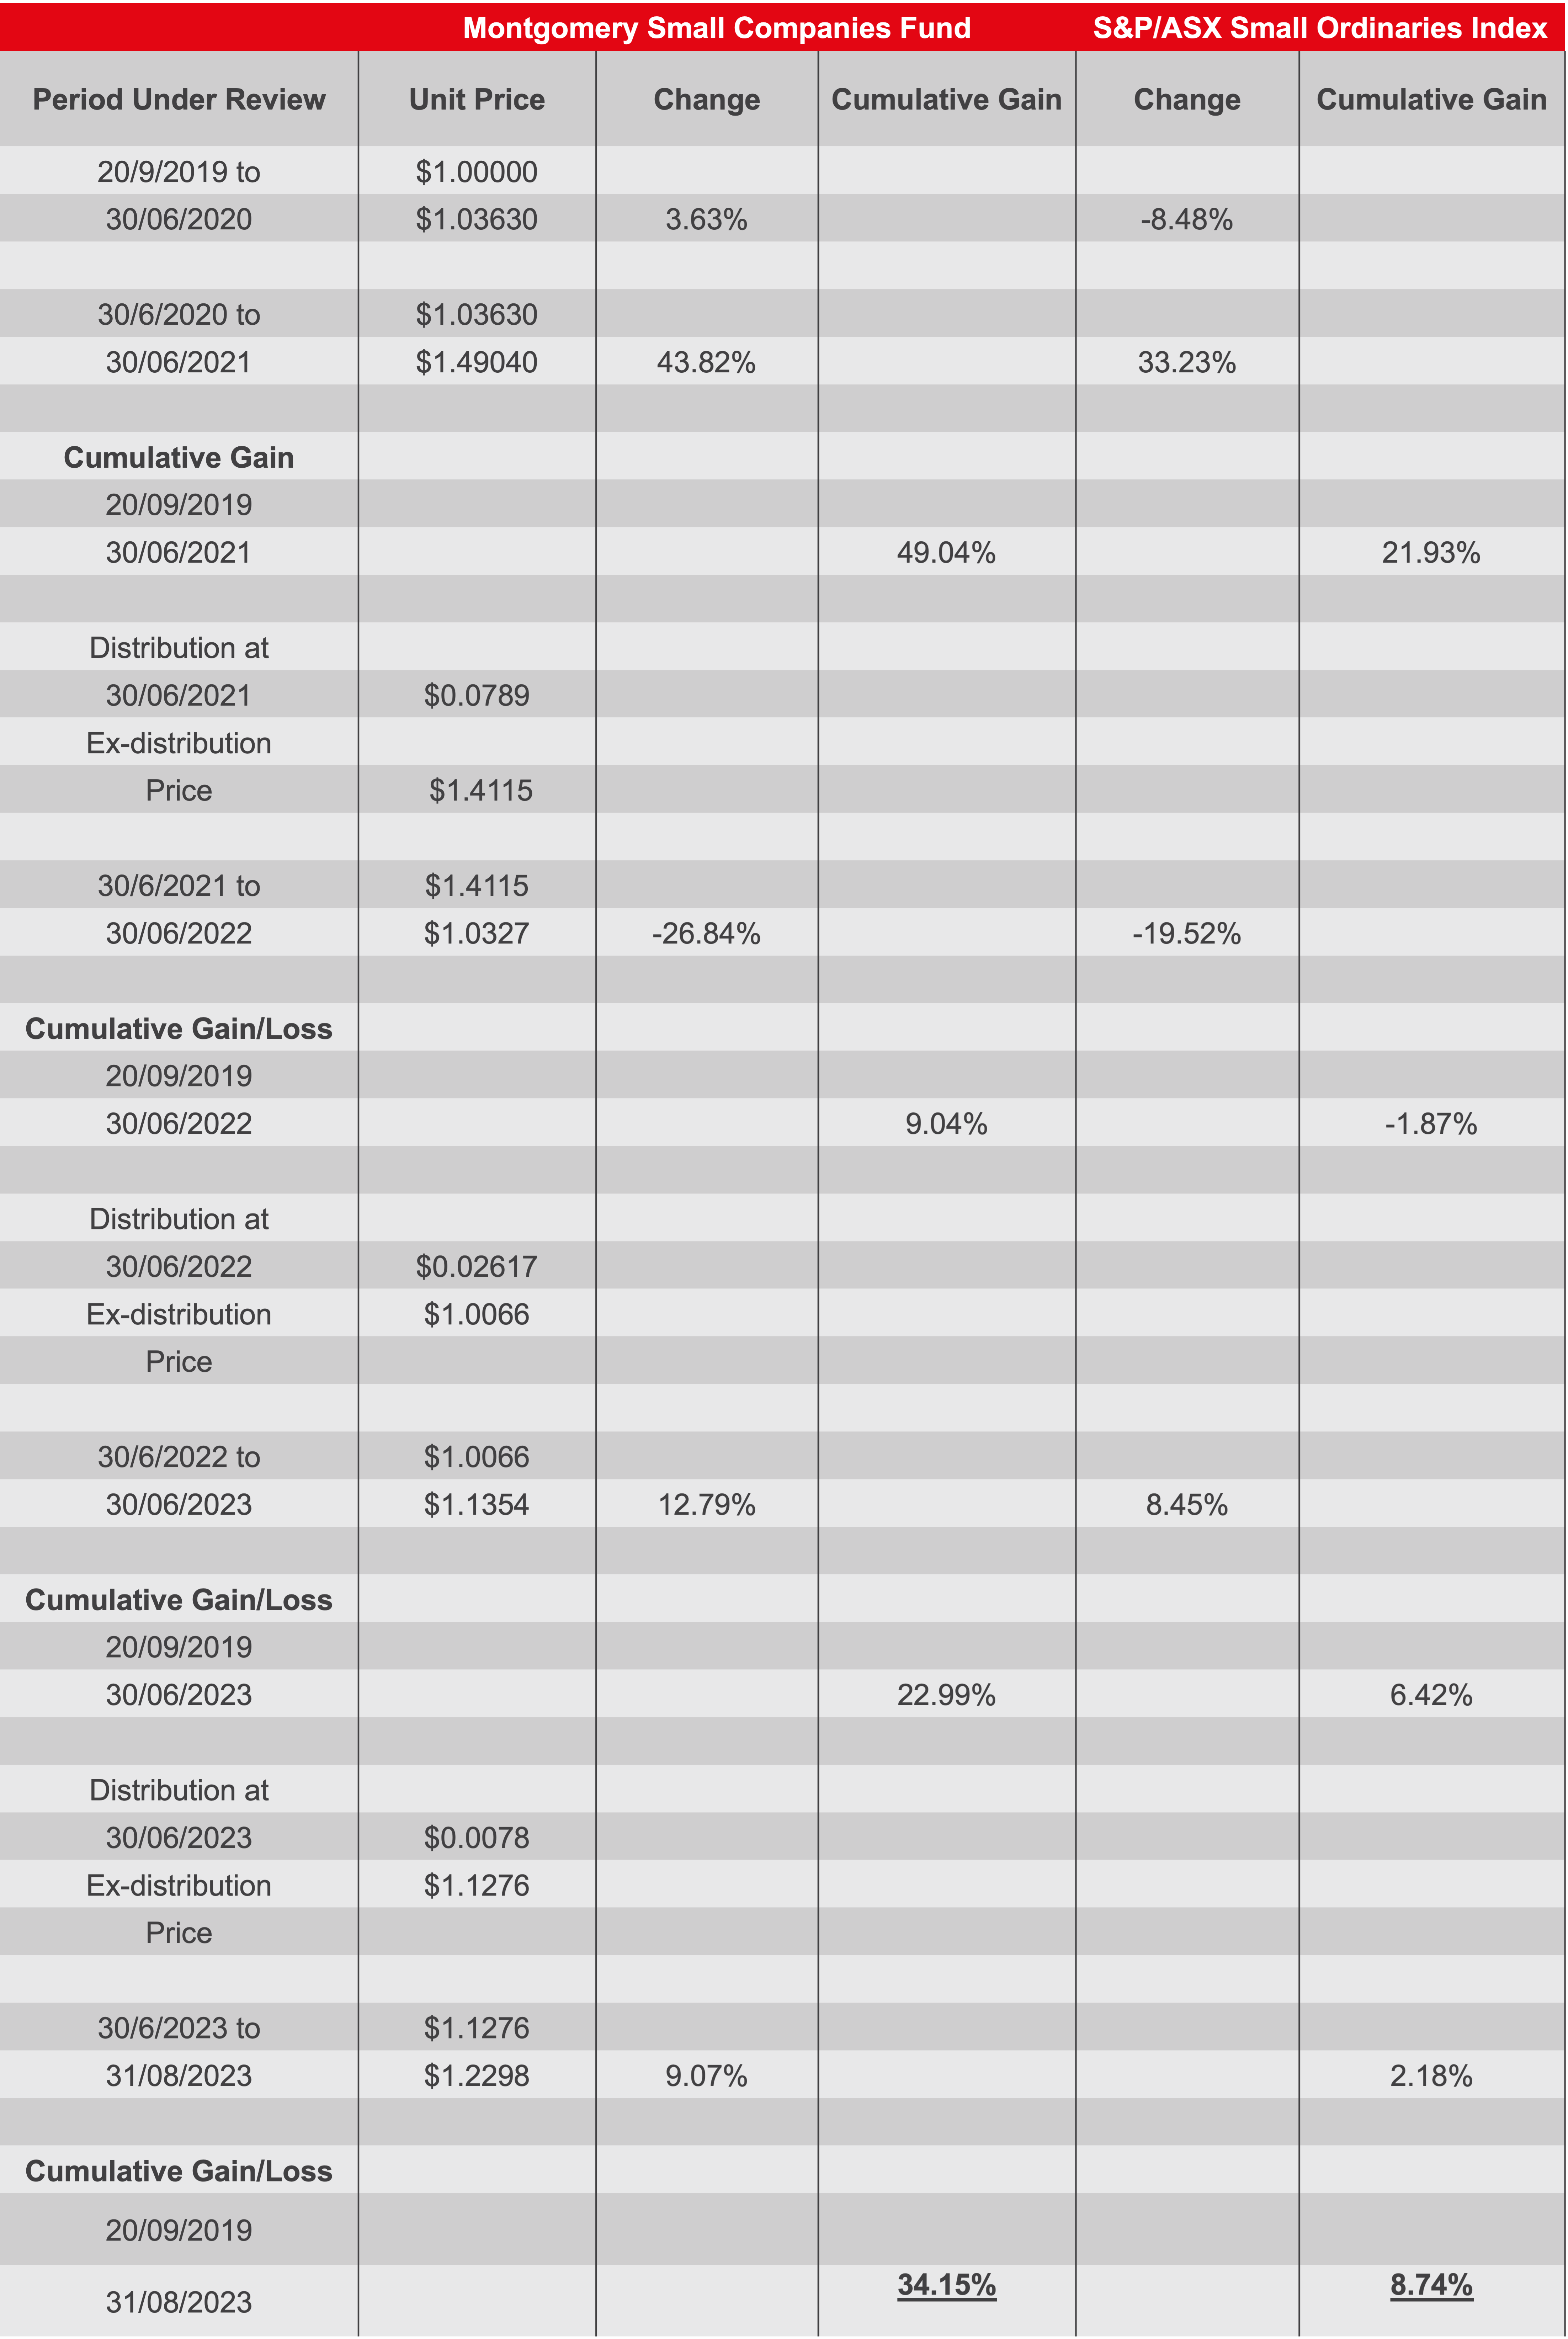
How do we arrive at a 34.15 per cent return in the period 20 September 2019 to 31 August 2023?
By 31 August 2023, the unit price of the Montgomery Small Companies Fund was $1.2299, and The Fund had paid out a total of 11.2857 cents per unit in distribution, being 7.8912 cents at 30 June 2021, 2.6168 cents at 30 June 2022 and 0.7777 cents at 30 June 2023.
I have broken down the returns, payments and reinvestment schedule as follows.
The issuer of units in Montgomery Small Companies Fund (ARSN 635 229 533) (Fund) is the Fund’s responsible entity Fundhost Limited (ABN 69 092 517 087) (AFSL 233045). The Fund’s investment manager is Montgomery Lucent Investment Management Pty Limited (ABN 58 635 052 176, Authorised Representative No. 001277163). Copies of the PDS and Target Market Definition (TMD) are available from Montgomery Investment Management, contactable on (02) 8046 5000 or at www.montinvest.com and at https://fundhost.com.au. An investment in the Fund must be through a valid paper or online application form accompanying the PDS. Before making any decision to make or hold any investment in the Fund you should consider the PDS and TMD in full. The information provided does not take into account your investment objectives, financial situation or particular needs. You should consider your own investment objectives, financial situation and particular needs before acting upon any information provided and consider seeking advice from a financial advisor if necessary. You should not base an investment decision simply on past performance. Past performance is not an indicator of future performance. Returns are not guaranteed and so the value of an investment may rise or fall.
Chief Executive Officer of Montgomery Investment Management, David Buckland has over 40 years of industry experience.
David is a deeply knowledgeable and highly experienced financial services executive. Prior to joining Montgomery in 2012, David was CEO and Executive Director of Hunter Hall for 11 years, as well as a Director at JP Morgan in Sydney and London for eight years.
This post was contributed by a representative of Montgomery Investment Management Pty Limited (AFSL No. 354564). The principal purpose of this post is to provide factual information and not provide financial product advice. Additionally, the information provided is not intended to provide any recommendation or opinion about any financial product. Any commentary and statements of opinion however may contain general advice only that is prepared without taking into account your personal objectives, financial circumstances or needs. Because of this, before acting on any of the information provided, you should always consider its appropriateness in light of your personal objectives, financial circumstances and needs and should consider seeking independent advice from a financial advisor if necessary before making any decisions. This post specifically excludes personal advice.
Excellent article.
Would it be possible to do the same analysis BUT, given that most people do NOT reinvest but take the distributions as income, separate the capital growth from the dividends distributed over the same time periods and then compare to the ASX?
Hi Joe, over the period under review, being 20 September 2019 to 31 August 2023:
From an accumulation basis (assuming distributions/ dividends are reinvested), the Montgomery Small Companies Fund has turned $1.00 into $1.3415, whilst the S&P/ASX Small Ordinaries Index has turned $1.00 into $1.0874.
On a price only basis (assuming all distributions/ dividends are not reinvested), the Montgomery Small Companies Fund has turned $1.00 into $1.2299, whilst the S&P/ASX Small Ordinaries Index has turned $1.00 into $0.9828.
Thank you, David.