History shows us how rising rates affect equity returns
Instead of trying to speculate when the market will turn around, I think investors would be better off focusing on changes in interest rates. After all, history teaches us that changes in interest rates, and the extent to which rates rise beyond consensus estimates, are a major determinant of price-to-earnings (P/E) ratios and, therefore, sharemarket returns.
The Spanish philosopher, poet and novelist, George Santayana, famously observed, “Those who cannot remember the past are condemned to repeat it.” And in a 1948 speech to the House of Commons, Winston Churchill paraphrased Santayana when he said, ‘Those who fail to learn from history are condemned to repeat it.’
Last week the U.S. Federal Reserve raised rates by 75 basis points, sending stocks, particularly technology stocks, tumbling. Accompanying the announcement was Fed Chairman Powell’s message that, although the Fed might start raising rates in smaller increments, where they end up may now be higher than FOMC members believed as recently as September.
There’s some speculation that the market’s reaction has been overdone. Clearly, the Fed will eventually need to slow the pace of rate increases but doing so increases the possibility of a return of investor exuberance. By speaking of where rates might ultimately go, the Fed Chairman managed to signal the pace of rate hikes would slow, without triggering another wave of investor excitement.
Following the U.S. Fed’s move, the Bank of England raised its key interest rate for the eighth time, and by 0.75 percentage points. It was the largest single increase in 33 years. The UK benchmark lending rate now sits at three per cent, and ominously, it is at the highest level since 2008.
Importantly, for long-term investors, where rates ultimately peak, and when they peak, is useful information. Buying high-quality companies, enjoying double-digit growth, on low P/Es today, can be a more comfortable exercise if reasonable estimations can be made about when spring might finally emerge from the chilling market winter.
And that’s where history might help.
I recently read a report from macroeconomic research house Trahan, examining prospects for the U.S. housing market. The author provided recent historical data on the relationship between inflation, the Fed Funds Rate and bond rates, and when short and long-term rates tend to peak in relation to each other.
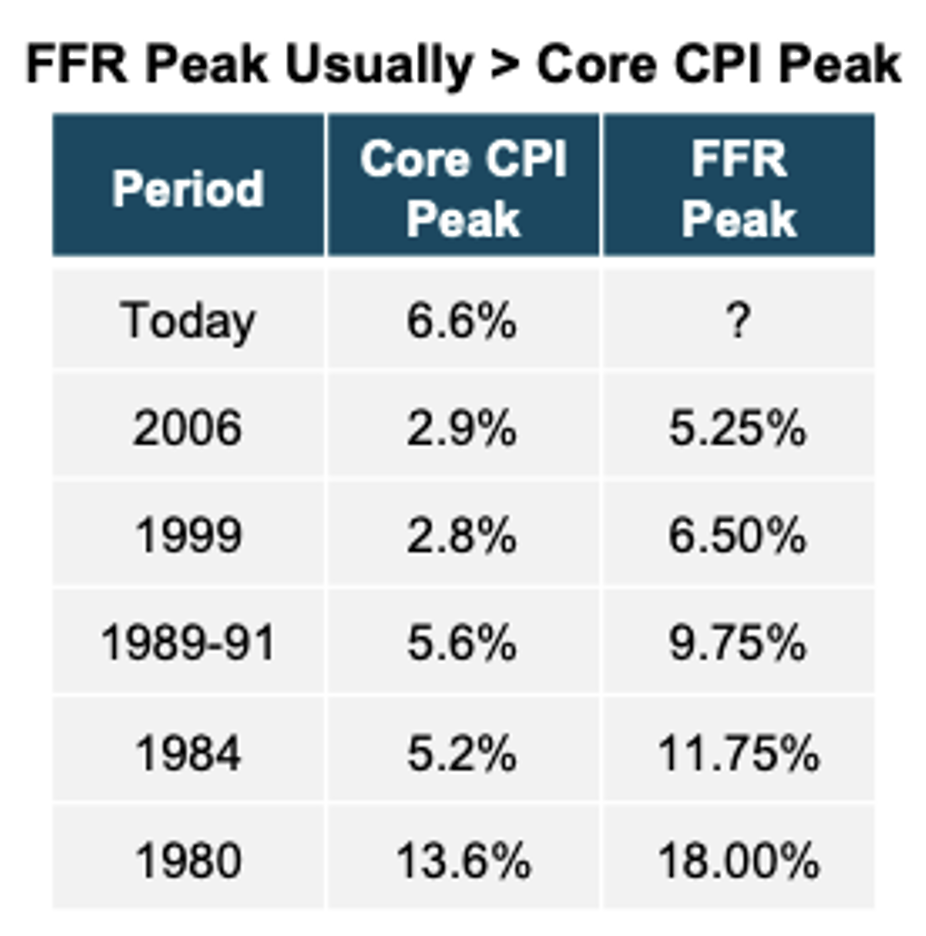
The executive summary is as follows. Historically the U.S. Fed Funds Rate (FFR) peaks at a higher level than the peak in Core CPI. Today, Core CPI sits at 6.6 per cent and the FFR is set in a range between 3.7 to 4.0 per cent. If history repeats it suggests the U.S. Federal Reserve has a way to go and the Fed will be tightening for longer than current consensus estimates. Indeed the FFR could double from here if history repeats.
Separately, history also suggests bond yields peak a few months before the end of Federal Reserve tightening of the FFR and at a higher rate than the FFR.
That all suggests the FFR, which currently sits at 3.7 – 4 per cent could rise to 6.75 per cent, while U.S. 10-year bond yields, which currently trade at 4.16 per cent, could rise to 6.75 per cent.
On the surface, the prediction provided by history portends some serious consternation for markets.
Billions are spent annually on the salaries of those who work to predict what the U.S. Federal Reserve does next and where rates will go. And remember the U.S. Fed doesn’t know itself. Indeed, the Federal Open Market Committee’s own dot plot reveals members have changed their forecasts of the level and timing of peak rates a number of times this year already.
As Table 1. reveals, the peak in the FFR in each episode has been higher than the peak for Core CPI. According to Morningstar on 21 October 2022, consensus expects the FFR to peak at four per cent at the end of 2023. History suggests consensus estimates might be too low.
Table 1. Where U.S. Core CPI and Fed Funds Rate peaked

Source: Trahan Macro Research
And it is worth remembering core inflation is typically a ‘stickier’ version of inflation, and tends to lag the business cycle, meaning even if the economy starts to slow, core inflation may not. In such a scenario, talk of stagflation will become more common than it is today.
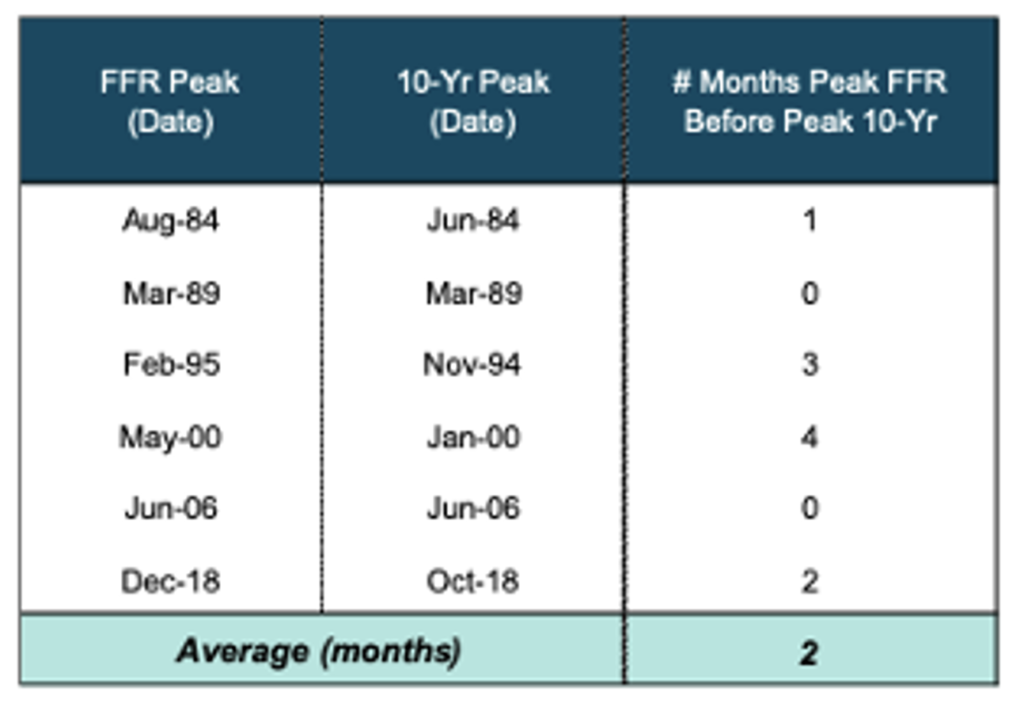
With respect to the equity market, there are well-documented relationships between returns and bond yields. We have written about these many times in the past. Four decades of data reveal, with respect to Federal Reserve rate hikes, the bond market relationship to FFR peaks is reasonably consistent. Table 2. shows bond yields peak between one and four months before the ultimate peak in the FFR.
Table 2. When U.S. 10-year bond rates peak

Source: Trahan Macro Research
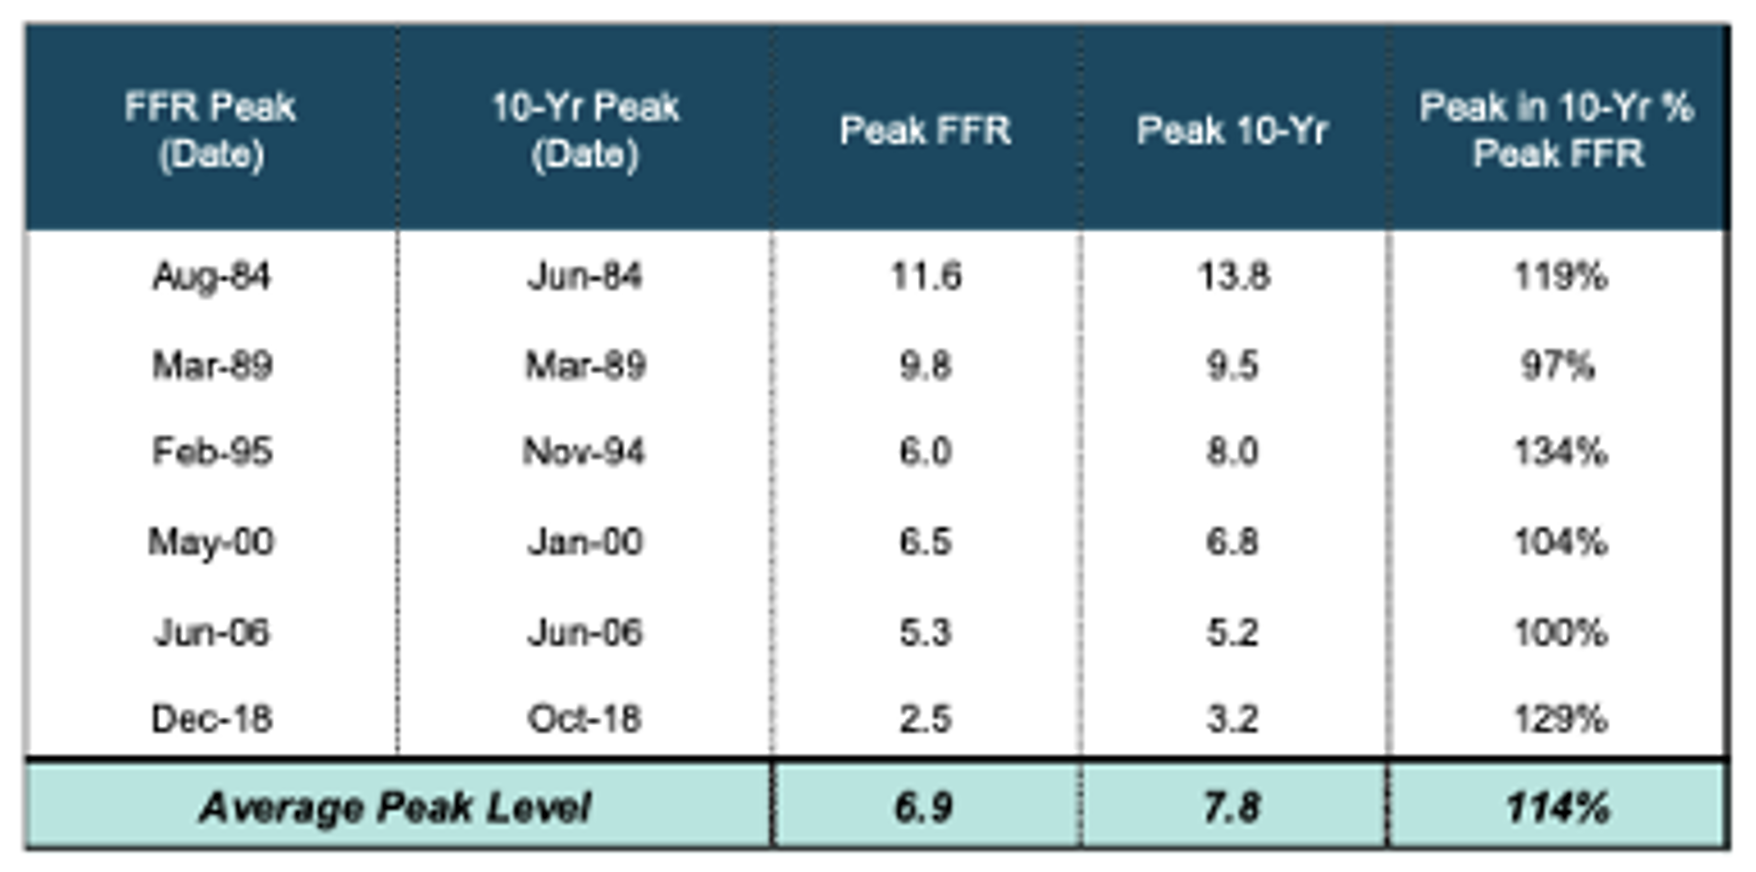
Historical data, as shown in Table 3., also reveals 10-year Treasury bond yields tend to peak at an even higher level than the FFR.
Table 3. 10 Year Treasury bond yield peak at higher levels than Fed Funds Rate

Source: Trahan Macro Research
U.S. 10-year Treasury yields, at the time of writing, sit at 4.16 per cent. History suggests they have some way to rise. If the current episode repeats the historical track record, U.S. 10-year Treasuries could go as high as six or even seven per cent. That seems difficult to accept today and is miles away from consensus currently. A shift in sentiment that accepts such an outcome might be a proper black swan event.
Irrespective of the extreme nature of the conclusions, history argues the current rate of core inflation foreshadows both higher Fed Funds and 10-year bond rates than where we are today.
That could translate to a further contraction in P/E ratios, something we are very keen to gain some insight into, for obvious reasons, and have written about extensively.
Finally, the stock market is itself a leading indicator of the economy, not the other way around. That means fears of recession, even if they prove prescient, are probably already factored-in. It is, rather, the change in interest rates, and the extent to which they rise beyond consensus estimates, that will be a major determinant of P/E ratios and therefore returns for equity investors.