Good news for equities. Investors can expect higher liquidity
Putting value to one side, the price of an asset cannot rise unless investors buy it. And, in order to buy it, they require liquidity. Tracking global liquidity can go some way to explaining, if not predicting, the path of asset prices.
During the COVID pandemic, global economic policy changes saw government spending surge without a commensurate tax increase. The result was a transformational shift to issue debt to fund the gap. And this change now collides with a structural requirement to issue even more debt.
Government fiscal burdens will inevitably skyrocket as aging demographics reduce their tax-take, and technological changes, particularly automation, reduces employment income while increasing social welfare obligations. A new epoch for debt markets, and therefore qualitative easing (QE), has emerged and will remain for years.
As macroeconomics research house Crossborder Capital notes, “At circa US 350 trillion Worldwide, debt is already a huge burden…The re-financing demands for liquidity just to roll over existing debts are more than monetary policymakers believe is compatible with restoring low inflation. They also suggest, “To ensure financial stability, how can policymakers supply sufficient liquidity for markets? The solution lies in once again expanding Central Bank balance sheets (QE)…The scale of this task will require greater cooperation between Central Banks and their Finance Ministries.”
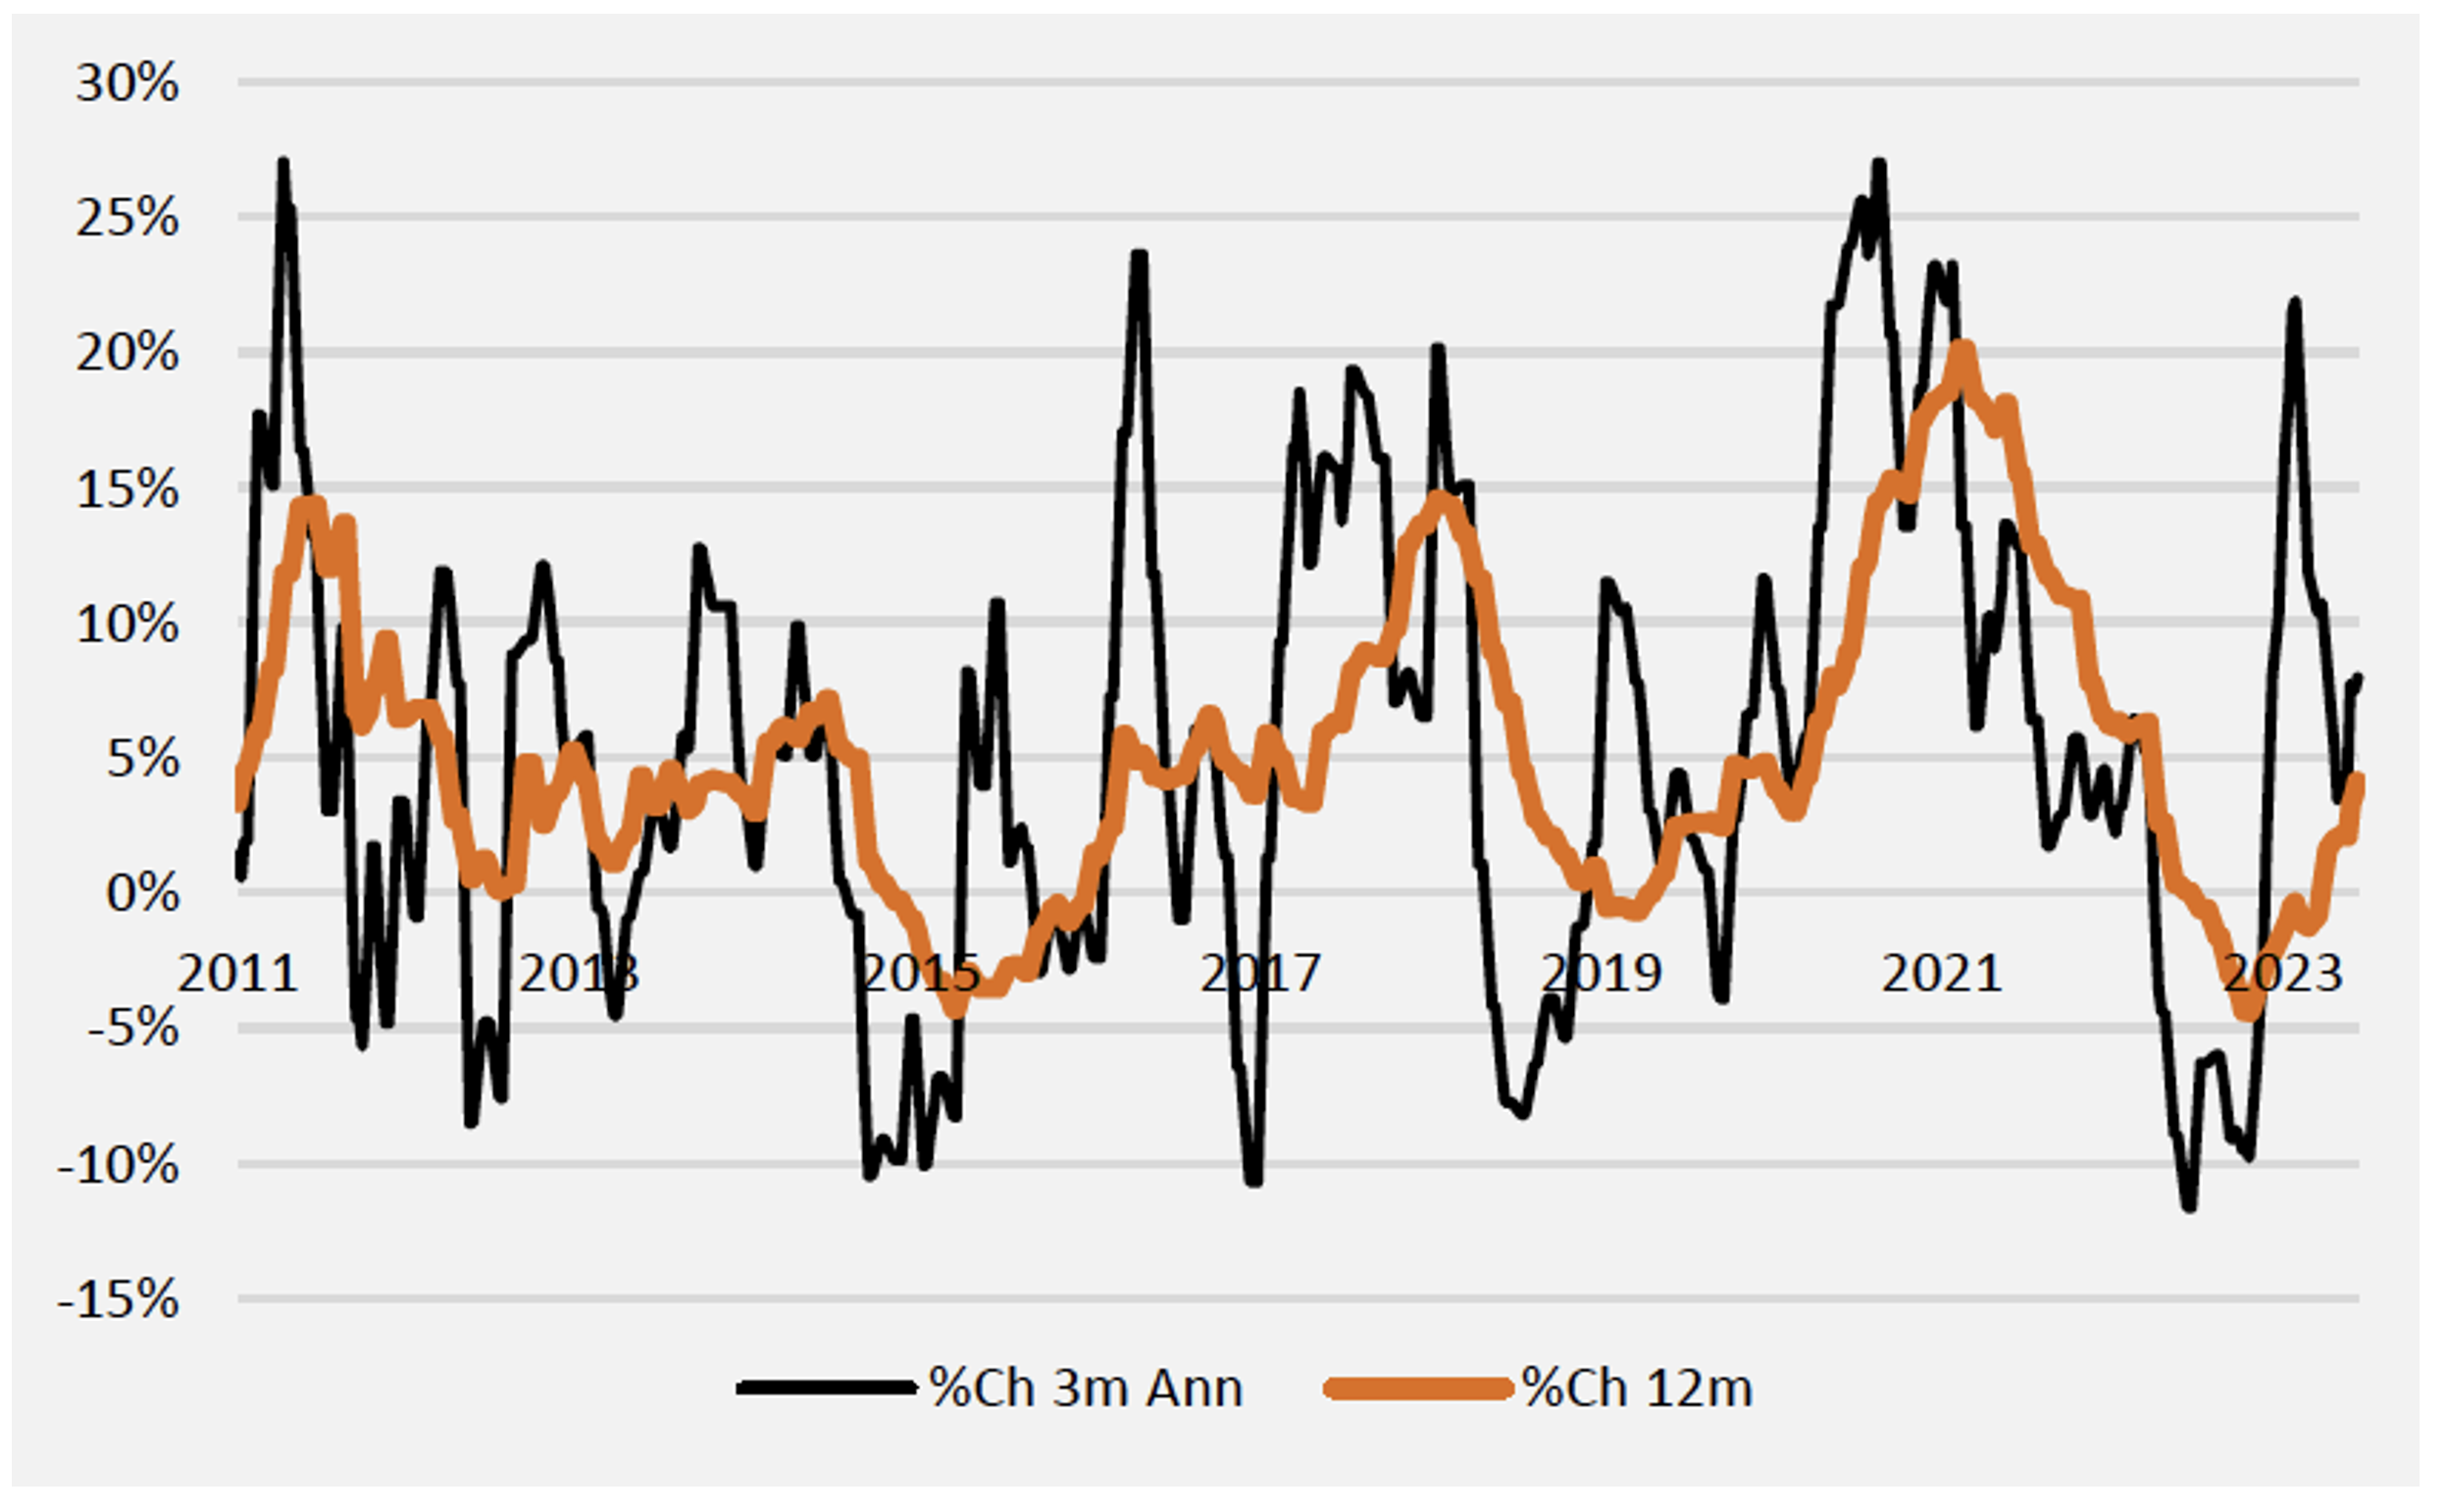
Figure 1. Global Liquidity, weekly, 3 million annualised and 12 million year on year change (%)

Source: Crossborder Capital
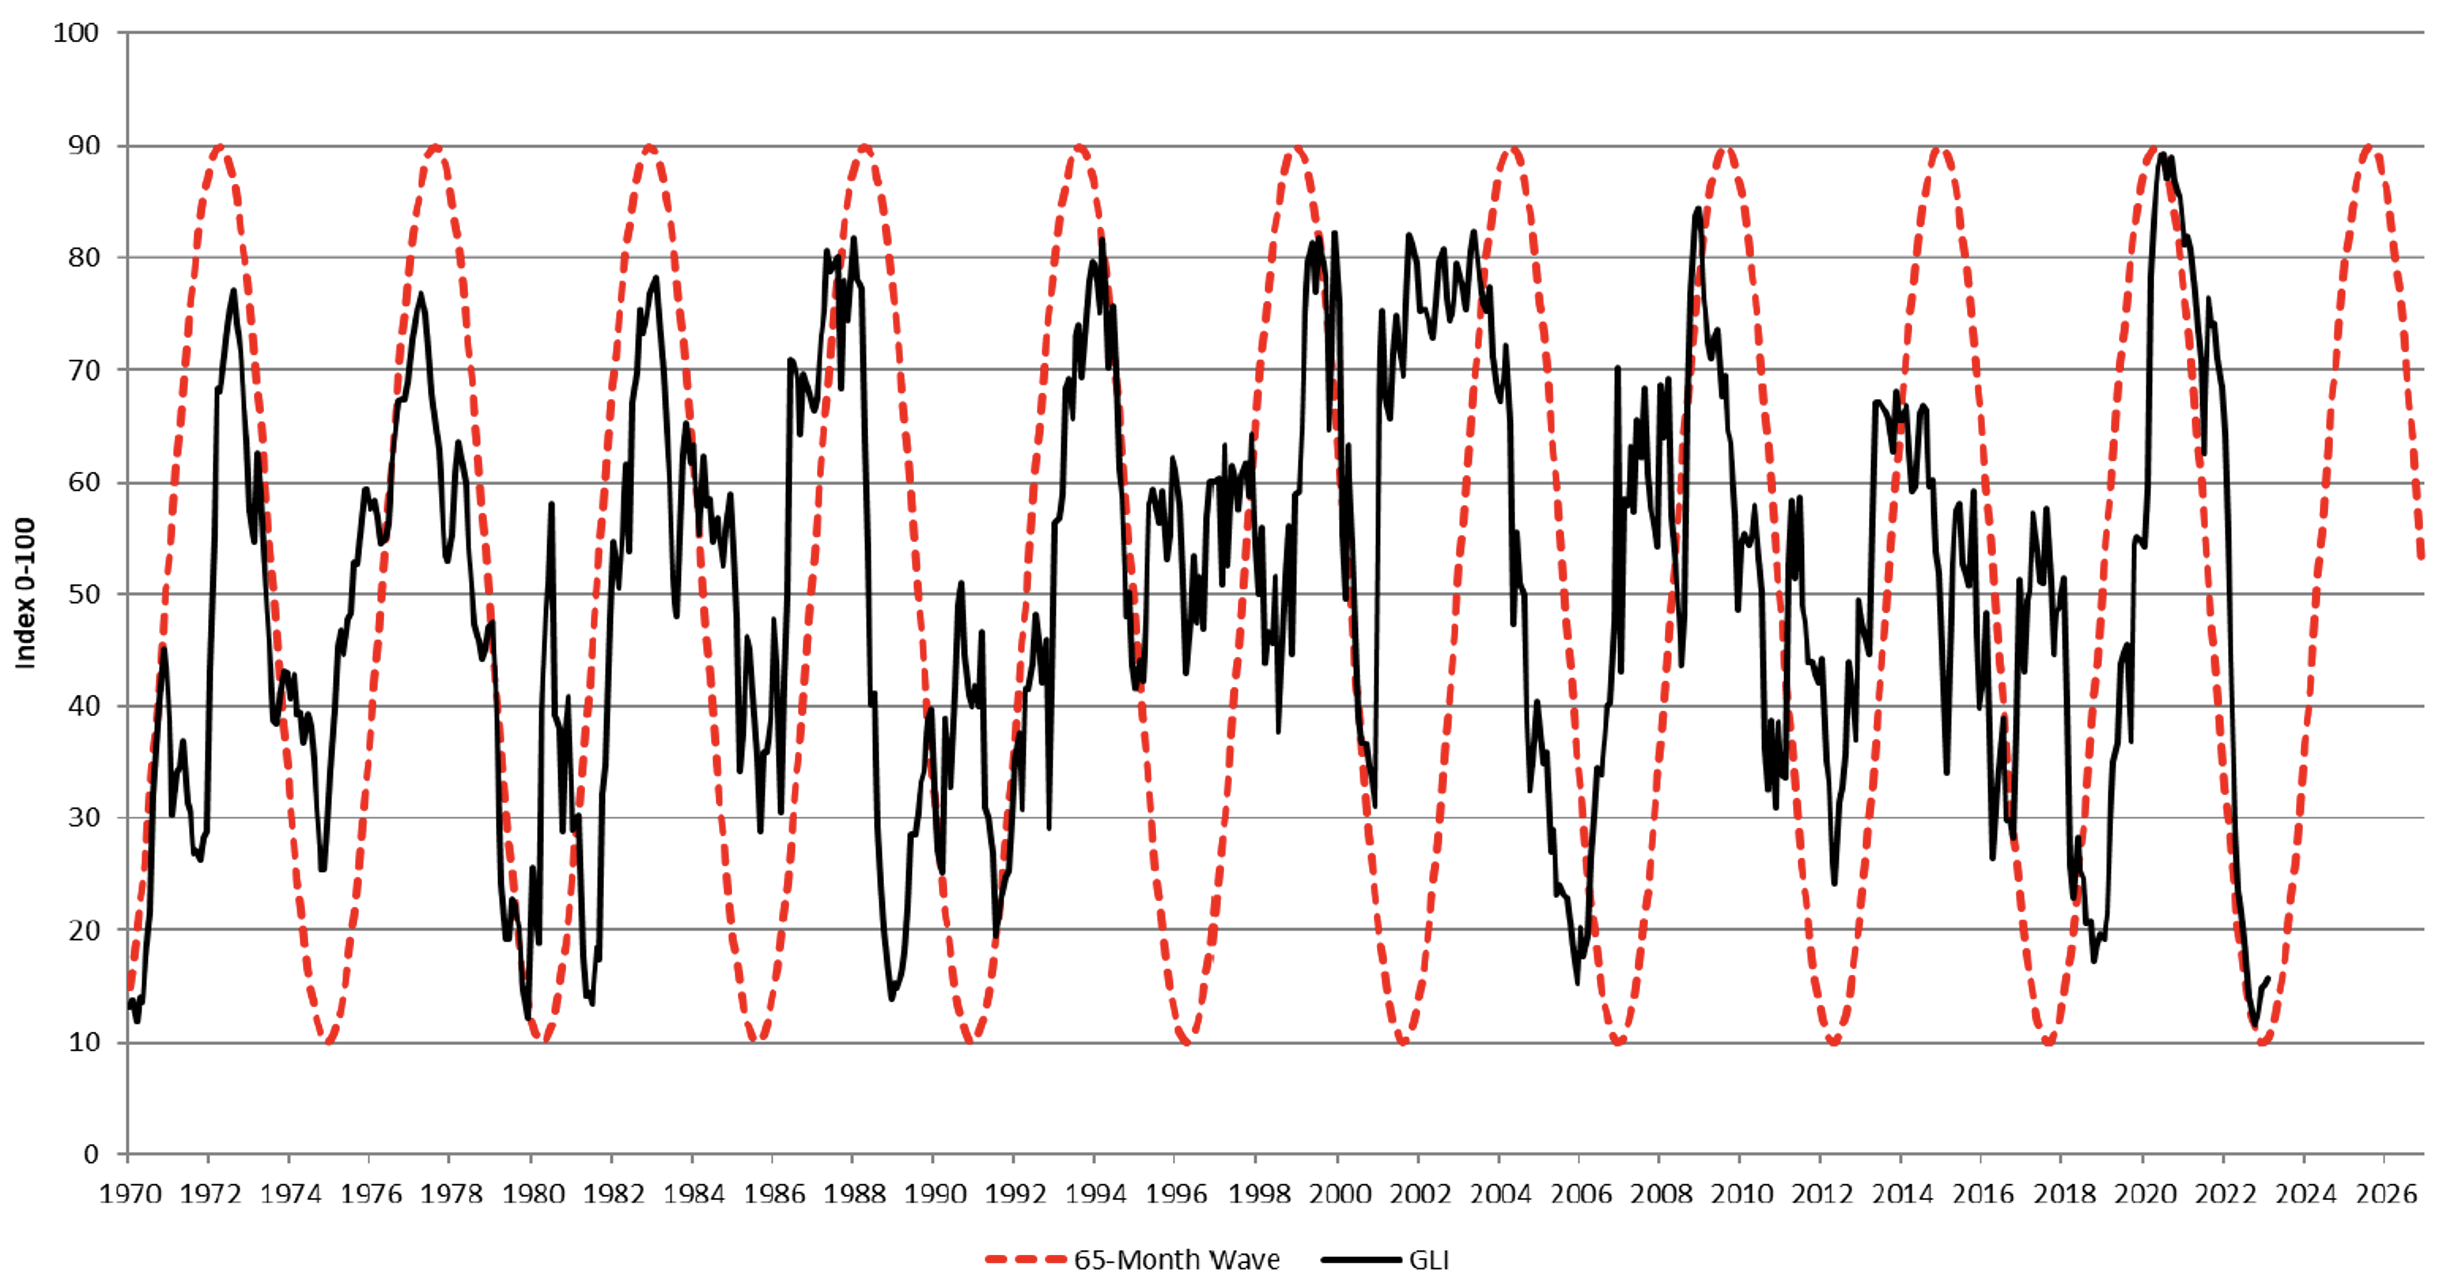
As Figures 1. and 2., reveal, global liquidity is bottoming and rising after being flattened over the past 18 months. Once again, financial stability concerns (remember the Silicon Valley Bank collapse?) loosened policy. Predictably, QE will have to accelerate now as recessionary pressures build, and this may be preferred to loosening interest rates, which would reignite animal spirits, undermining the work of the rate rises to date. Under this scenario, interest rates are likely to remain ‘higher for longer’ and QE accelerates as rescuing Silicon Valley Bank transitions to rescuing the US Government’s fiscal quagmire.
Figure 2. Crossborder’s Global Liquidity Index and 65-month cycle

Source: Crossborder Capital
Historically, higher liquidity has been good for equities. A combination of rising liquidity, disinflation and economic growth (albeit anemic) will be very good for stocks, especially those of innovative companies that are growing strongly.
As I noted in early 2022, “a contracting U.S. Federal Reserve balance sheet (tapering or shrinking) tends to produce lower returns for S&P500 equity investors. Importantly, except for the COVID-19 sell-off in 2020, every period of negative year-on-year returns for the S&P500 since 2010 coincided with tapering balance sheet growth or a shrinking balance sheet.
According to CrossBorder’s correlated wave/cycle, liquidity will keep rising for the next three years, and into 2026.
As we know, the return from investing in the shares of a company that grows its Earnings Per Share (EPS) by 15 per cent, at the same Price Earnings (P/E) ratio as which it is sold, produces a return to the investor that equals the REPS growth rate (15 per cent). That knowledge compels the investor to buy the shares of businesses able to grow.
The return, however, can be higher if the P/E expands. And on that front, it’s interest rates and inflation that will determine whether P/Es expand over the next three years.
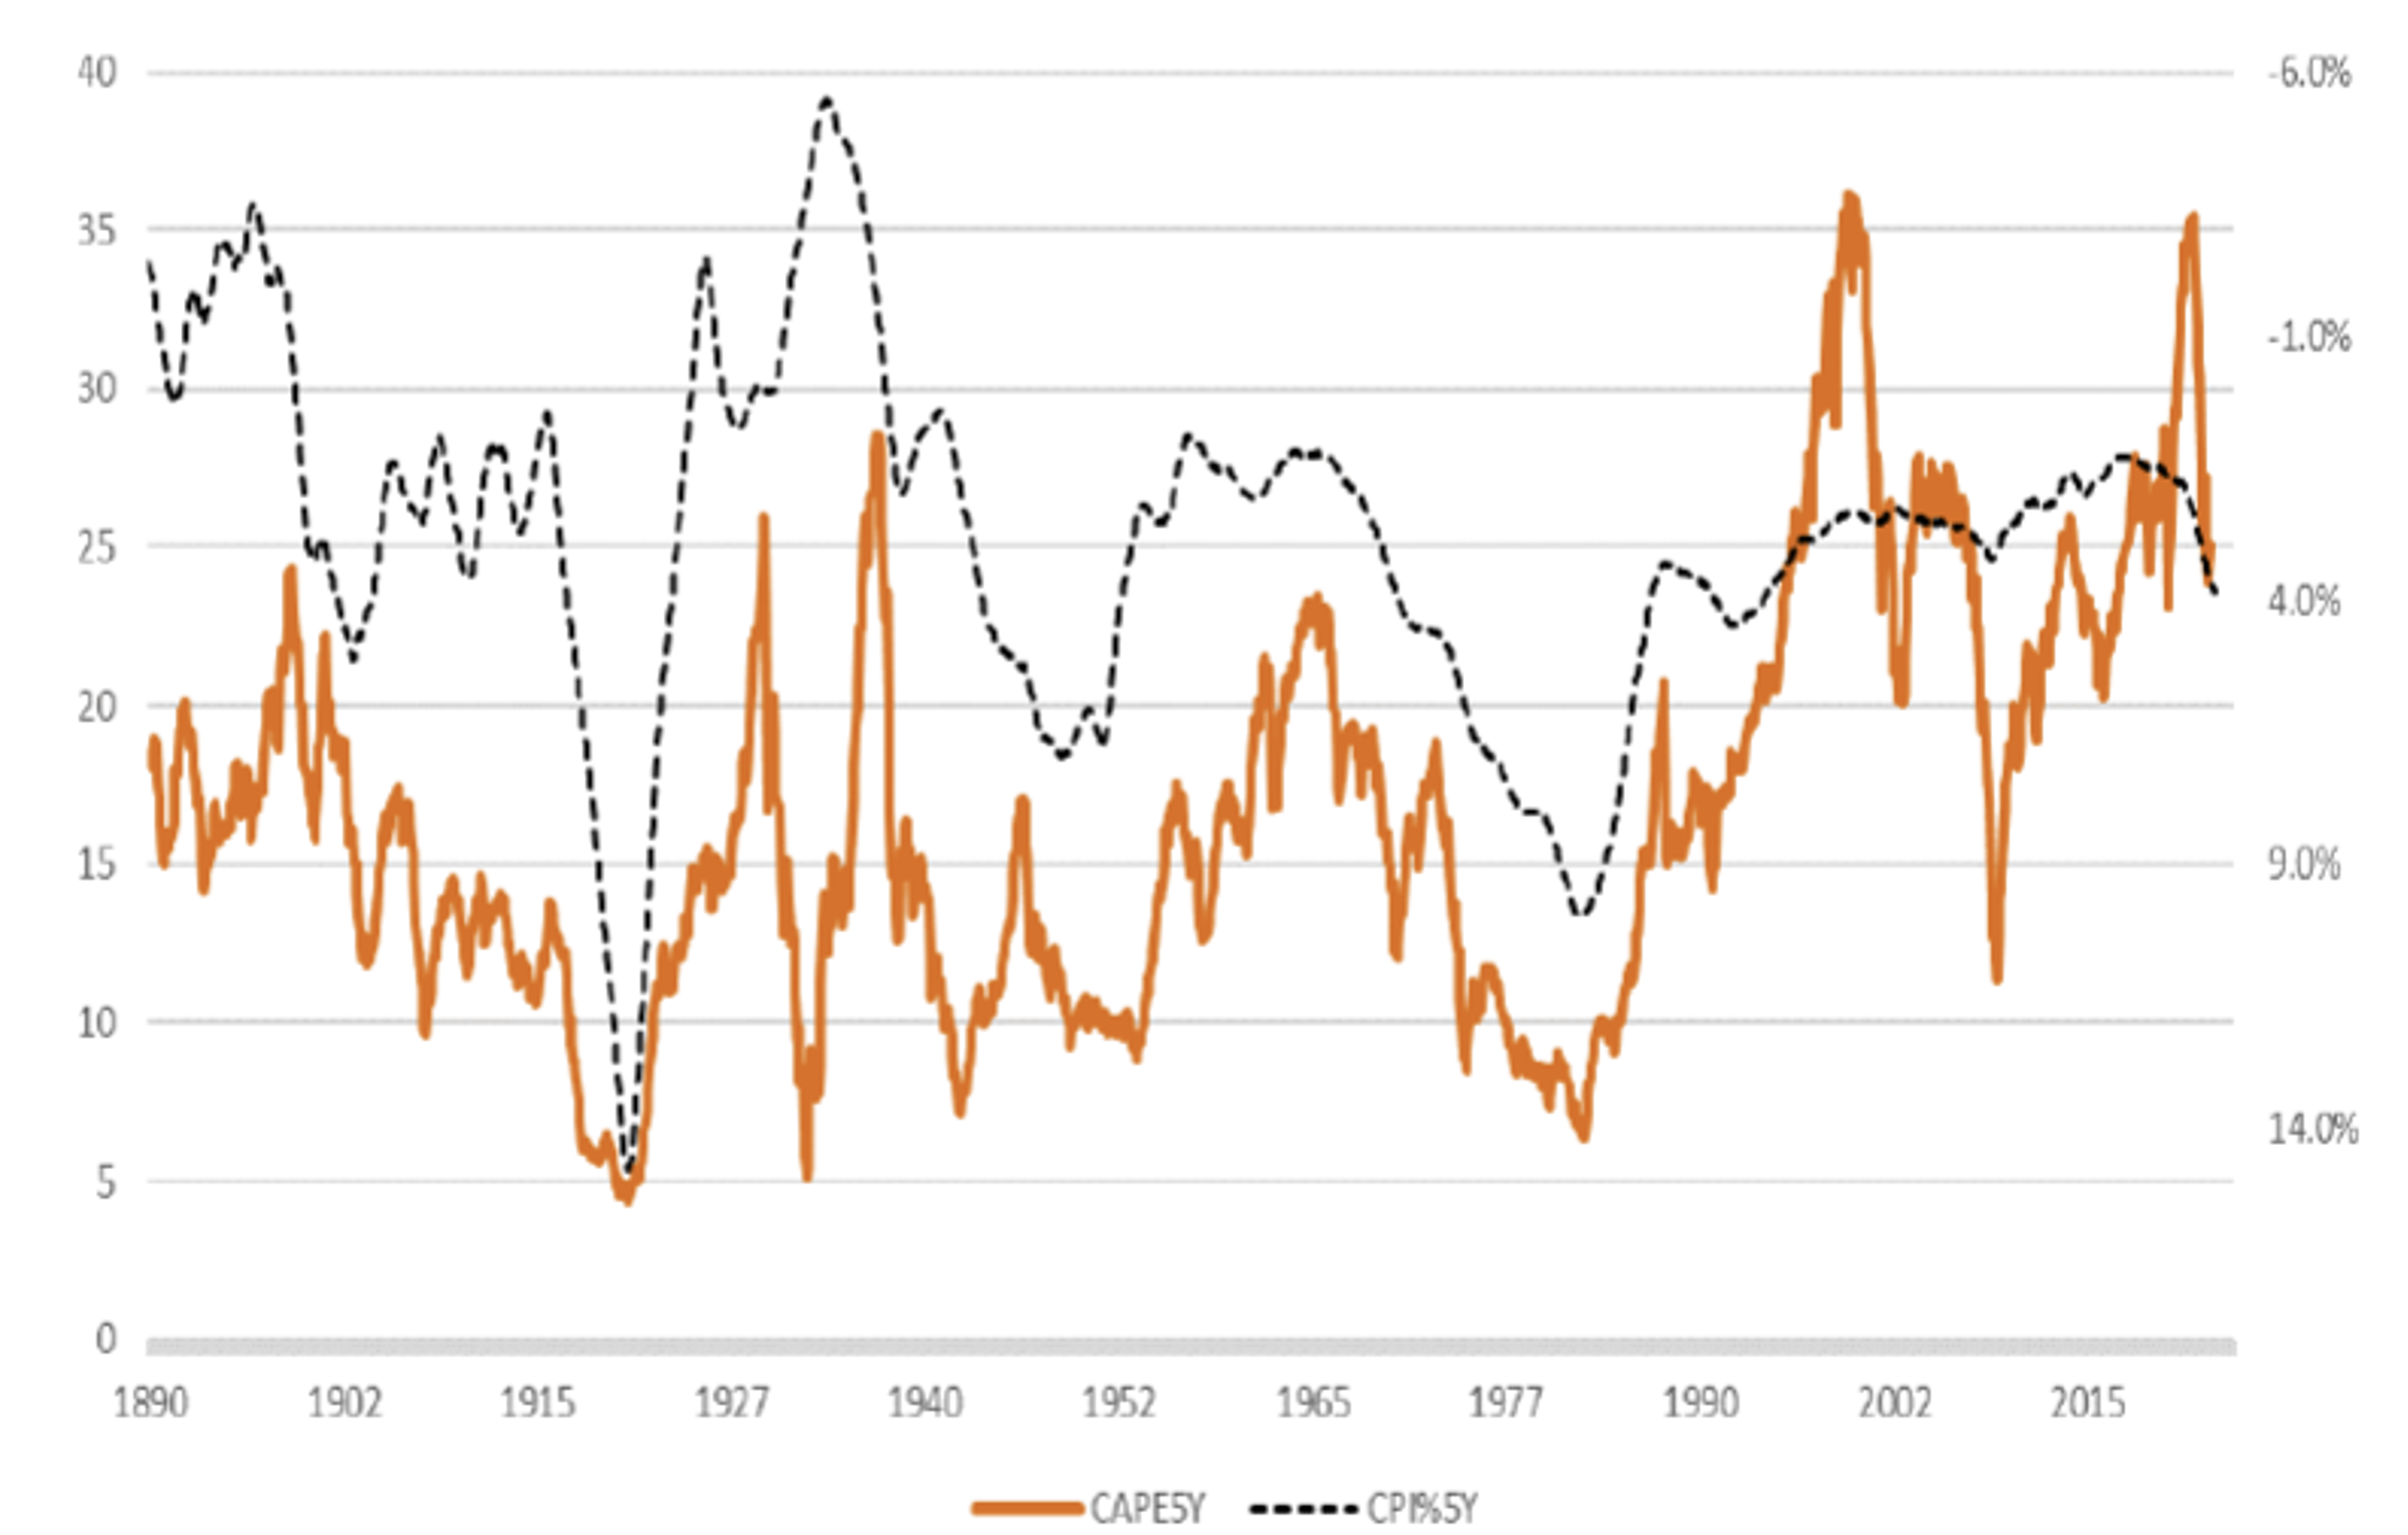
Figure 3. 5-year CAPE and 5-year CPI% (inverted)

Figure 3., reveals a good correlation between inflation (inverted) and P/E ratios, in this case, measured with the five-year Cyclically Adjusted PE Ratio (CAPE). There is an inverse relationship between inflation and the P/E ratio. Generally, investors are willing to pay more for a stock’s dollar of earnings when inflation is low, driving the P/E ratio higher. On the other hand, when inflation is accelerating, investors aren’t willing to pay as much for each dollar of a stock’s earnings, forcing the P/E ratio lower.
As I explained back in February 2022, “Whenever inflation or interest rates have risen over the last four decades, the multiple of earnings investors have been willing to pay for shares has declined.” The reverse is also true. Disinflation will promote higher P/E ratios.
Back in 2000 the U.S. Federal Reserve’s paper Reexamining Stock Valuation and Inflation: The Implications of Analysts’ Earnings Forecasts, by Stephen Sharpe, noted, “The negative relation between equity valuations and expected inflation is found to be the result of two effects: a rise in expected inflation coincides with both (i) lower expected real earnings growth and (ii) higher required real returns”, adding, “A one percentage point increase in expected inflation is estimated to raise required real stock returns about one percentage point, which on average would imply a 20 per cent decline in stock prices.”
More importantly, for a company that grows its earnings meaningfully, a P/E contraction will prove a depressing but transitory influence on the share price. In any event, even if the P/E doesn’t expand again, growth in earnings will drive the share price higher. Of course, this takes time for a company to achieve. That delay to prices going up – in tandem with earnings – provides investors with an opportunity. The opportunity is even more rewarding if P/Es are compressed at the time of purchase, as they are now, and if conditions work to subsequently expand the P/E ratio again.
It is reasonable now to expect inflation to decelerate, to record ‘disinflation’. That has been historically very good for P/E expansion. Investing in small companies that are growing faster will also help to secure a positive return on investment, even in the absence of expanding P/E ratios. But expanding P/E ratios may reasonably be expected, given disinflation.
We should also expect the Fed’s balance sheet to expand as QE accelerates, driving global liquidity, which lubricates and fuels investor buying. And again, historically, there is solid evidence of a correlation between Fed balance sheet expansion and contraction and S&P500 returns. Index returns are higher when QE is underway.
All told, the combination of depressed P/E ratios amid recessions fears, the cusp of a new era of QE and declining rates of inflation are a positive stage upon which to begin adding risk to portfolios through the purchase of select small-cap funds focused on innovative high-quality and growing businesses, domestically and globally.
Qualitative Easing: consists in central bank policies that deteriorate the average quality of the assets that it holds. This can occur both with and without quantitative easing
Hi Roger,
I was wondering if you could explain to me if the Chinese car manufacturer BYD listed on the LSE is the same as buying shares in the BYD company on the HKE?
The one listed on the LSE appears to be the same company but shares are quoted in USD and certain information such as the P/E isn’t listed on the LSE version but is on the HKE version?
Thanks
Trent
BYD trades on multiple exchanges. There are the A-shares in China, the H-shares in Hong Kong, US-dollar ADRs in London, and I believe there’s an OTC 9over the counter) available in the US. Hope that helps Trent.