Exploring a Bank’s Earnings
The income of Australia’s major banks is largely dependent on the economy’s appetite for credit. When credit growth is modest, as it has been of late, the banks must reduce costs in order to maintain earnings growth. But this stage of the credit cycle also presents an earnings tailwind in the form of lower impairment charges, which the banks have been enjoying.
A bank’s earnings are largely dependent on lending, and the likelihood that these loans will be repaid. The provision for loan losses is a forecast by the bank that is treated as an expense. There has been an improvement in the customer’s ability to repay loans since the GFC, as we have experienced record-low interest rates and relatively low levels of unemployment. Hence a greater share of bank profits has been from falling provisions. For instance, the Commonwealth Bank of Australia (ASX:CBA) reported 14 per cent growth in before-tax profit for the December 2013 half-year. Of this, 3 per cent was attributable to falling provisions.
So what is the likelihood that this trend will continue?
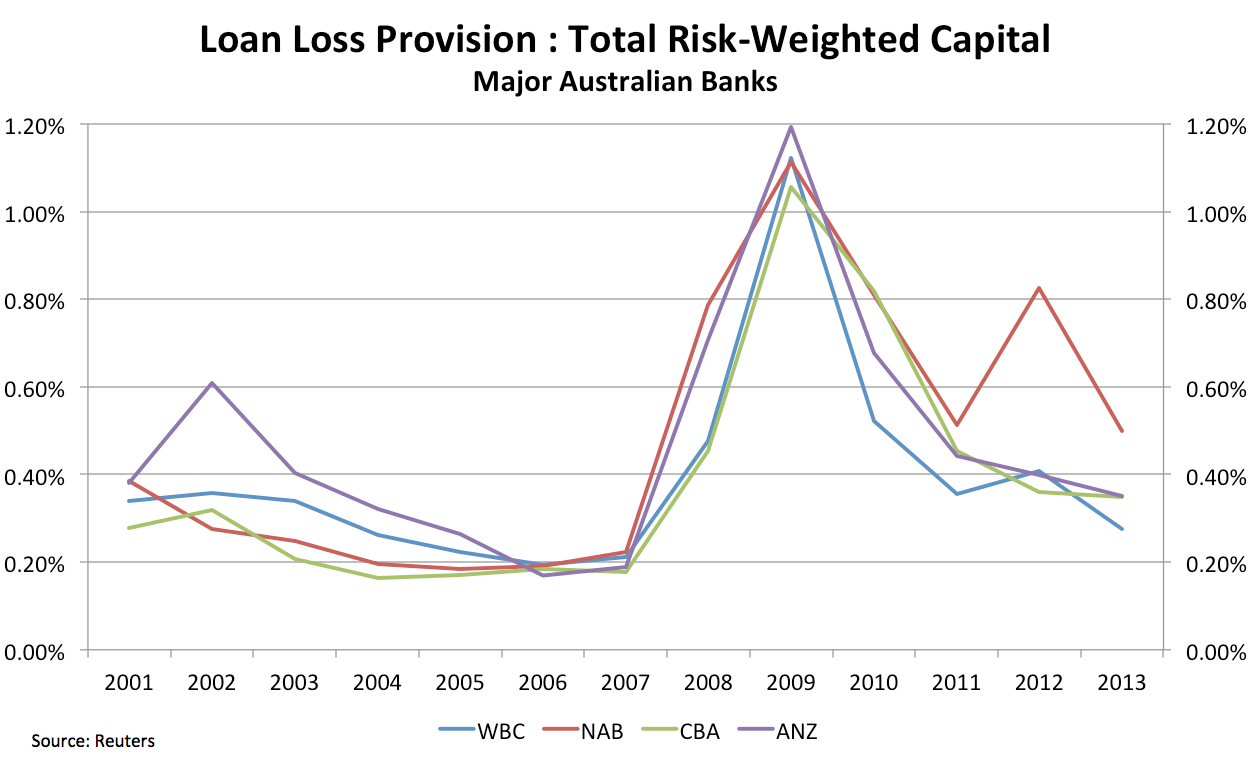
The chart below represents the proportion of loan loss provisions to total risk-weighted capital of Australia’s four major banks. As you can see from the chart, the credit cycle is not characterised by smooth undulations. Rather, banks go through sustained periods of low provisions which are punctuated by sharp peaks.
When the consumer is taking on leverage, banks will experience credit growth, but may also experience an increase in the likelihood of unpaid loans. Bad debts spiked between 2008-2010 as the economy was shook by the GFC. The consumer has since transitioned to paying off their debts, resulting in slowing credit growth and falling loss provisions.
We can observe that while provisions have declined considerably since the GFC, there appears to be potential for further declines which should support earnings growth in the foreseeable future.
This post was contributed by a representative of Montgomery Investment Management Pty Limited (AFSL No. 354564). The principal purpose of this post is to provide factual information and not provide financial product advice. Additionally, the information provided is not intended to provide any recommendation or opinion about any financial product. Any commentary and statements of opinion however may contain general advice only that is prepared without taking into account your personal objectives, financial circumstances or needs. Because of this, before acting on any of the information provided, you should always consider its appropriateness in light of your personal objectives, financial circumstances and needs and should consider seeking independent advice from a financial advisor if necessary before making any decisions. This post specifically excludes personal advice.
INVEST WITH MONTGOMERY
Hi Ben
Nice piece. Quick question so I understand it a bit better. Is the chart showing the total provision to risk assets or the incremental provision added during the period? I would expect the former to not be as volatile as the latter.
Thanks.