
Could the U.S. default?
In a fascinating Wall Street Journal (WSJ) article, published this week, the U.S. state of Wyoming reportedly bought 2,312 ounces of gold in December after passing a law requiring the state’s investment portfolio to add precious metals as a hedge against economic turmoil.
According to the WSJ, “Among [Wyoming’s] worries are rising federal debt, inflation and a weak U.S. dollar – but also more extreme calamities, according to Bob Ide, a Republican state senator and lead sponsor of the ‘Wyoming Gold Act.”
For me, however, it was Ide’s comment about a U.S. default that piqued my interest, and should yours.
“I can’t put a timeline on it, but there’s gonna be a sovereign-debt crisis,” Ide said. “There’s no will to rein in spending.”
According to the latest reports from the U.S. Congressional Budget Office (CBO), the International Monetary Fund (IMF), and the Penn Wharton Budget Model, a U.S. sovereign debt crisis is not a certainty, but the structural maths is becoming increasingly precarious.
What drives a crisis?
In early 2026, the U.S. national debt held by the public had reached approximately 101 per cent of Gross Domestic Product (GDP), and annual interest payments had surged to nearly US$1 trillion, now rivalling or exceeding the entire national defence budget.
A sovereign debt crisis occurs when investors lose confidence in a government’s ability to repay its debt, leading to a spike in interest rates and a potential default. For the U.S., there are arguably three catalysts.
- Interest-growth
One risk is when the interest rate on the debt (r) stays consistently higher than the economy’s growth rate (g).
(r) represents the speed at which the debt (numerator) grows purely due to the cost of borrowing. If the government does nothing else, the debt increases by (r) every year.
(g) represents the speed at which the GDP (denominator) grows. Since tax revenue is generally a percentage of GDP, this is the speed at which the country’s repayment capacity grows.
When (r) > (g), the debt grows faster than the tax base used to pay for it, even if the government stops all new spending. This creates a debt spiral, and the debt snowballs automatically.
The relationship is often expressed as:
∆d = (r – g)d +pb
- d: Debt-to-GDP ratio
- r: Real interest rate
- g: Real economic growth rate
- pb: Primary balance (the deficit excluding interest)
If the primary deficit (pb) remains high while r exceeds g, the debt ratio (d) rises.
- Structural entitlement spending
The CBO identifies an aging population as the primary long-term driver. As Baby Boomers continue to retire, spending on Social Security and Medicare is projected to grow from roughly 10 per cent of GDP today to over 15 per cent by 2050. Without tax increases or benefit reforms, this creates a permanent, widening deficit.
- Erosion of privilege
The U.S. Dollar currently holds the status of the world’s primary reserve currency, which allows the U.S. to borrow at lower rates than other nations because global demand for ‘safe’ Treasury bonds is high. However, if geopolitical shifts or trade wars cause foreign investors (who hold trillions in U.S. debt) to diversify into other currencies (or gold), interest rates would spike, potentially triggering a sudden fiscal shock.
Gold’s place in the story
In 2025, U.S. gold exports more than doubled to over US$84 billion, accounting for nearly 90 per cent of the total increase in U.S. exports in some months.
Much of this gold is being routed through Switzerland before ending up in China, as Chinese demand for physical bullion (from both the central bank and private citizens) has hit record highs.
This flow is a physical manifestation of the de-dollarisation trade in action, representing a shift from digital promises (dollars/debt) to physical assets.
It’s important to appreciate that China is buying gold at the same time it is aggressively selling U.S. Treasuries. China’s holdings of U.S. debt fell to roughly US$682 billion in early 2026 – the lowest level since 2008. It appears China is moving toward a ‘value-for-value’ settlement system, where, by holding gold instead of dollars, it insulates itself from U.S. sanctions and the weaponisation of the dollar-based (SWIFT) financial system. Could China be preparing for war? Why else would it be worried about sanctions?
What does this have to do with a sovereign default?
Historically, gold prices fall when U.S. interest rates are high. However, in 2025–2026, gold surged past US$5,000/oz even as rates remained elevated. This suggests that global buyers are now pricing in sovereign risk rather than just chasing yield. And the most dangerous implication for the U.S. is U.S. Treasury buyers leaving.
For decades, China was a price-inelastic buyer of U.S. debt, effectively funding U.S. deficits. But if China (and others like India, Poland or Brazil) continues to swap Treasuries for gold, the U.S. must find new buyers for its debt. And with a growing debt pile, new buyers of scale are increasingly hard to find.
To attract new buyers to replace the Chinese central bank, the U.S. could be forced to offer higher interest rates. On a US$38 trillion debt load, however, even a 1 per cent increase in rates would add nearly US$400 billion to the annual deficit, accelerating the debt.
If the trend continues, the risk of a failed Treasury auction of U.S. bonds – where the U.S. government tries to borrow money and finds insufficient demand – increases. This would be the definitive starting point of a sovereign debt crisis.
When could the U.S. debt crisis begin?
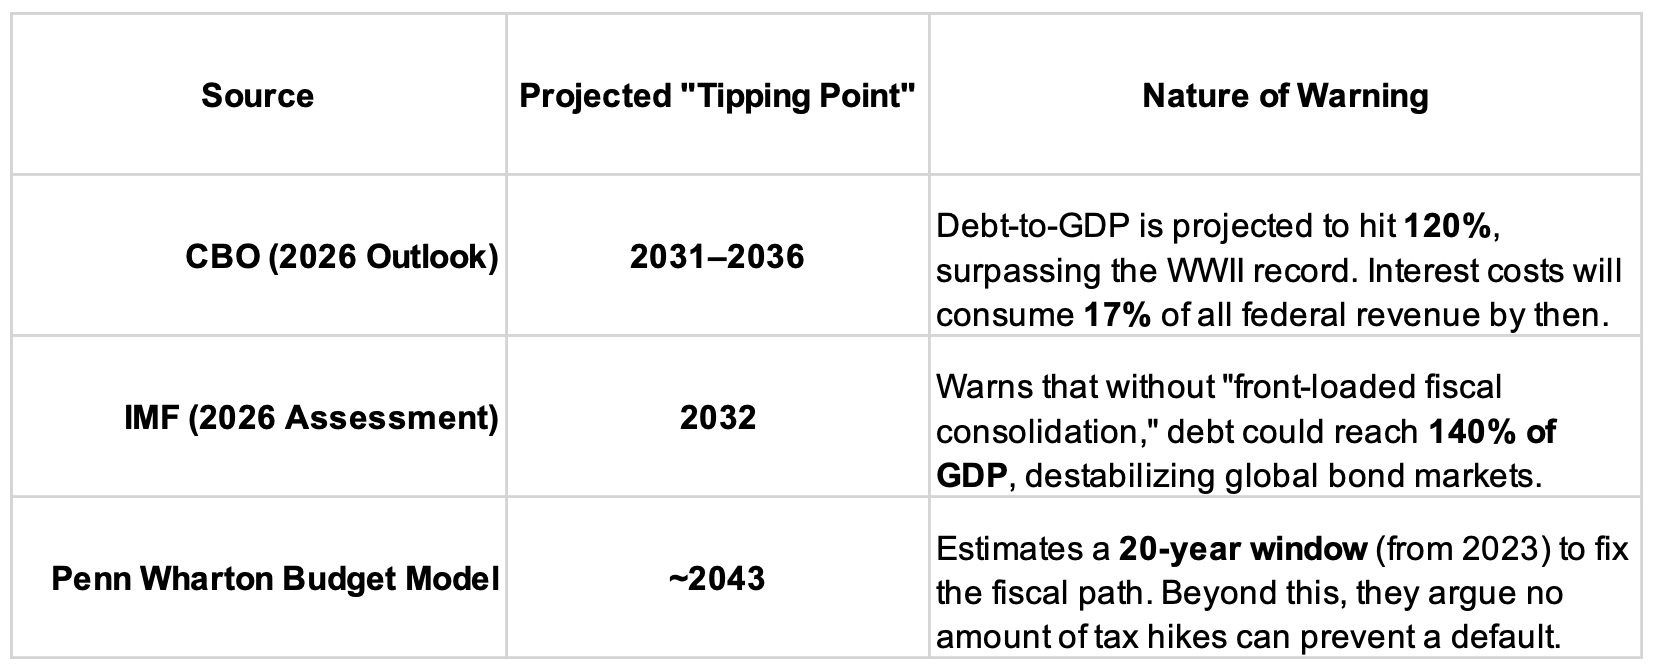
It pays to look to reputable organisations to gain insight into the different windows of concern, and each offers a different perspective, shown in Table 1:
Table 1. ‘T Minus Crisis’
Why a crisis hasn’t happened yet
Despite the unnerving numbers, the U.S. enjoys some unique protections other countries do not.
For example, the U.S. Treasury market is (currently) the most liquid in the world; there is literally no viable alternative for large-scale global capital currently.
Moreover, because the U.S. borrows in its own currency, it can technically never run out of money (although printing money indefinitely to pay debt risks hyperinflation).
Finally, and perhaps a little optimistically, some economists argue that if artificial intelligence (AI) or other technologies trigger a massive surge in productivity, which would accelerate economic growth (g), the U.S. could grow its way out of the debt.
What to watch
The drum of default will beat increasingly loudly, and the conga line of ‘doom and gloom’ investors and commentators spruiking a sovereign debt crisis as the debt continues to build. But the most immediate ‘red flag’ won’t be a 101 per cent,110 per cent or 115 per cent number on a spreadsheet. It will be a failed Treasury auction, where the government offers bonds and finds no buyers at reasonable interest rates. That would be the canary in the coal mine for a true sovereign crisis. Equity investors would then need to act fast.
Monitoring U.S. Treasury auctions will become essential viewing for investors in due course.
Because Primary Dealers (the likes of JPMorgan or Goldman Sachs) are contractually obligated to bid on their pro-rata share of every auction, a Treasury auction technically cannot fail to sell out. However, an auction would fail in the market’s eyes if demand is so weak that Treasury is forced to pay a much higher interest rate than expected.
The most reliable source is the government’s own portal. Results are usually released within two minutes of the auction closing.
TreasuryDirect – Auction Results is ground zero for data. You need to look for the PDF ‘Today’s Auction Results’ for the specific maturity (e.g., 10-year Note, 30-year Bond).
When you open an auction result PDF, you can ignore most of the numbers and focus on these three metrics to determine if the auction was weak (failed):
- The tail (The most critical metric)
Before the auction, the market trades bonds in a ‘When-Issued’ (WI) market. The live market price at the moment the auction closed is the ‘When-Issued’ yield. This is basically the market’s predicted interest rate.
If the actual auction result High Yield exceeds the WI Yield, the auction has ‘tailed.’
A tail of 1–2 basis points (0.01 per cent – 0.02 per cent) is a ‘soft’ auction, while a tail of 4+ basis points is considered a major warning sign of falling demand.
If, on the other hand, the actual auction High Yield was lower than the When-Issued yield at the time of the deadline, it means the auction ‘Stopped Through’, which is a bullish signal for U.S. Treasuries, suggesting buyers were willing to accept a lower yield just to ensure they received their allocation.
- The bid-to-cover ratio
This is the total dollar amount of bids received divided by the amount of debt the Treasury is selling. In the U.S. Treasury Auction, the bid-to-cover is calculated by dividing Total Tenders Received by Total Tenders Accepted.
For a sign of solid demand, look for a number above 2.50. If the ratio drops toward 2.0 or below, it means there were barely enough buyers to go around. This is a sign of a ‘thin’ market, and where any future crisis would start.
- Indirect bidders (The ‘foreign’ category)
This category primarily represents foreign central banks and international investors.
According to many observers, Indirect Bidders usually account for 60 per cent –75 per cent of a healthy auction, so if this number drops significantly (e.g., below 60 per cent), it confirms the widely discussed de-dollarisation trend. It may suggest that China, Japan, or the Middle East are stepping away from funding U.S. debt.
Conclusion:
According to the CBA, IMF and Wharton, you may not need any of this for at least another five years, but my experience is that major turning points are impossible for humans to predict. In other words, it could happen at any time, so it’s best to be prepared.
If you would to talk to someone at Montgomery about diversifying your investment portfolio beyond equities and bonds, please call either Rhodri Taylor or David Buckland on (02) 8046 5000 or email them at investor@montinvest.com.
Roger Montgomery is the Founder and Chairman of Montgomery Investment Management. Roger has over three decades of experience in funds management and related activities, including equities analysis, equity and derivatives strategy, trading and stockbroking. Prior to establishing Montgomery, Roger held positions at Ord Minnett Jardine Fleming, BT (Australia) Limited and Merrill Lynch.
He is also author of best-selling investment guide-book for the stock market, Value.able – how to value the best stocks and buy them for less than they are worth.
Roger appears regularly on television and radio, and in the press, including ABC radio and TV, The Australian and Ausbiz. View upcoming media appearances.
This post was contributed by a representative of Montgomery Investment Management Pty Limited (AFSL No. 354564). The principal purpose of this post is to provide factual information and not provide financial product advice. Additionally, the information provided is not intended to provide any recommendation or opinion about any financial product. Any commentary and statements of opinion however may contain general advice only that is prepared without taking into account your personal objectives, financial circumstances or needs. Because of this, before acting on any of the information provided, you should always consider its appropriateness in light of your personal objectives, financial circumstances and needs and should consider seeking independent advice from a financial advisor if necessary before making any decisions. This post specifically excludes personal advice.