
Australia – the outlier with a highly levered consumer
Early in 2022, the official cash rates for most English-speaking developed economies were at or around zero. This historical low too often pushed many investors, for fear of missing out, into speculating on things they may now have preferred to avoid.
With the sharpest official cash rate increases for a very long time, it is understandable many are currently “sitting on their wallets” waiting for greater economic clarity. Official cash rates for four of the English-speaking economies, below, are now in a range of 4.25 per cent (UK) to 4.75 per cent (New Zealand and the US), the highest level recorded since the Global Financial Crisis.
|
New Zealand |
USA |
UK |
Canada |
Australia |
|
4.75% |
4.75% |
4.25% |
4.50% |
3.60% |
|
10 increases |
9 increases |
11 increases |
9 increases |
10 increases |
|
Highest level since 2008 |
Highest level since 2007 |
Highest level since 2008 |
Highest level since 2008 |
Highest level since 2012 |
Australia, with official cash rates of 3.60 per cent is the outlier, and I believe this is associated with the two points. One, approximately $600 billion of mortgages are being switched from a fixed rate (of around 2.0 per cent per annum) to a variable rate (currently at around 6.5 per cent per annum) over the 2023, 2024 and H1 2025 period, and two, most other mortgagees are on variable rates of interest.
The fixed mortgage loan at approximately 2.0 per cent per annum for two, three or four years offered by the banks over the COVID-related 2020, 2021 and H1 2022 period opened the flood gates, and new loan commitments jumped from around $20 billion per month to over $30 billion per month before moderating recently.
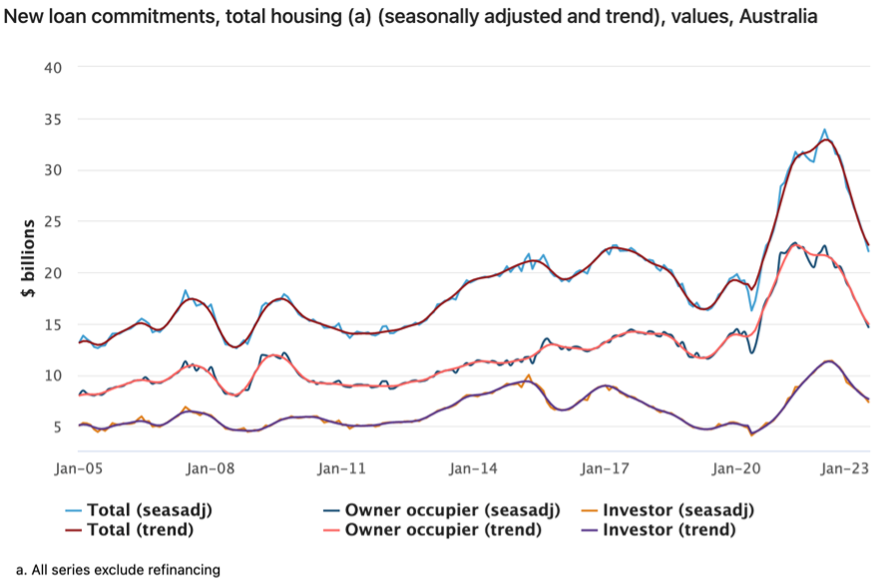
Source: ABS
The jump in variable rate mortgages massively out-weighs the benefits accruing to savers – it is calculated household deposits are around $175 billion above trend, and this is largely in the hands of the 65+ years of age cohort.
The issue for Australia is that our consumer is one of the most leveraged borrowers in the world. The current debt to income ratio approximates 2.0X, around double the ratio in the US, which hit closer to 1.4X at the height of their housing bubble.
Australian household debt to income ratio – a comparison
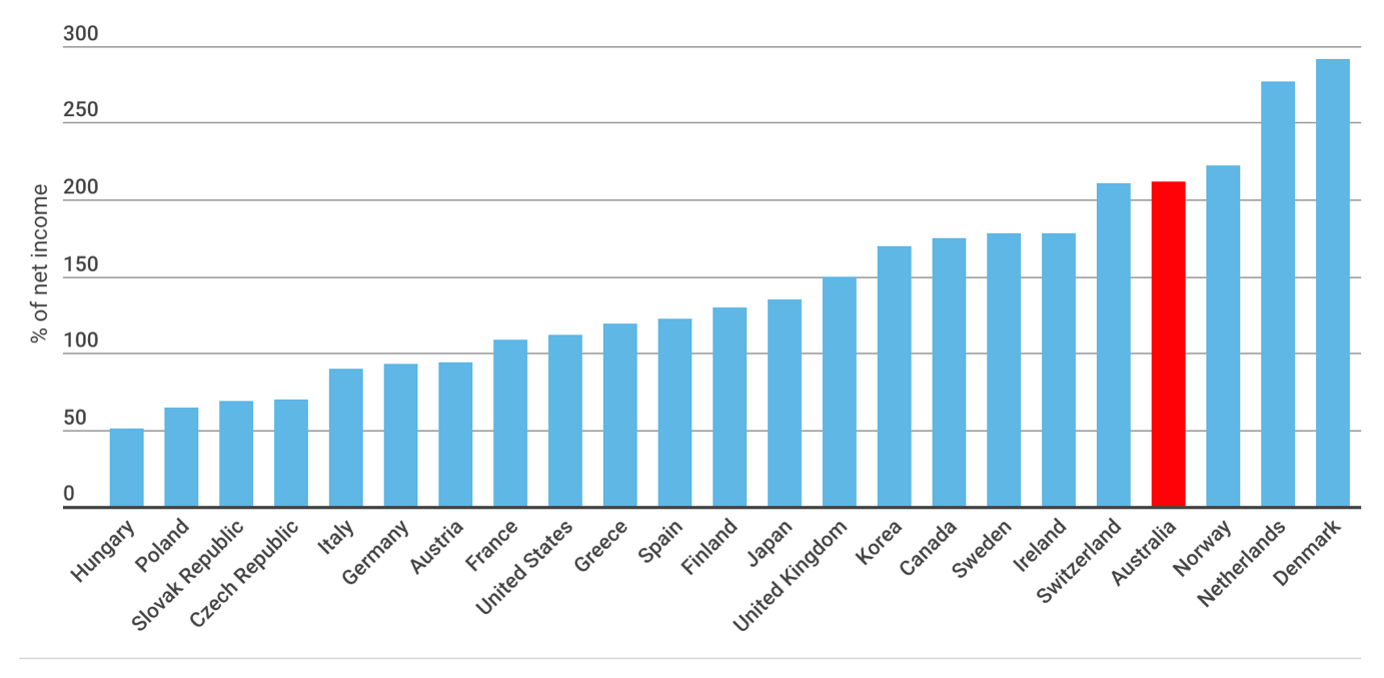
Source: Finder
As 2023 progresses, it seems to me most Australian consumers will be hard hit. The Reserve Bank of Australia put fuel on the housing fire “with rate rises unlikely prior to 2024” and they have a delicate balancing act between bringing inflationary expectations down whilst avoiding another “recession we had to have”.
Chief Executive Officer of Montgomery Investment Management, David Buckland has over 40 years of industry experience.
David is a deeply knowledgeable and highly experienced financial services executive. Prior to joining Montgomery in 2012, David was CEO and Executive Director of Hunter Hall for 11 years, as well as a Director at JP Morgan in Sydney and London for eight years.
This post was contributed by a representative of Montgomery Investment Management Pty Limited (AFSL No. 354564). The principal purpose of this post is to provide factual information and not provide financial product advice. Additionally, the information provided is not intended to provide any recommendation or opinion about any financial product. Any commentary and statements of opinion however may contain general advice only that is prepared without taking into account your personal objectives, financial circumstances or needs. Because of this, before acting on any of the information provided, you should always consider its appropriateness in light of your personal objectives, financial circumstances and needs and should consider seeking independent advice from a financial advisor if necessary before making any decisions. This post specifically excludes personal advice.
Let’s not forget the denominator here.. net income, Denmark has rather high income tax, so denominator is smaller..
Interesting that most countries are over 100% (I worked out mine based as a Gen-X, and I am at 26%); especially so with the outliers like Denmark and The Netherlands.
I expected they would have more of a Scandinavian / Teutonic attitude to money of “never pay too much, and pay what you owe”, so why are they so high ? (Denmark’s debt to GDP is 32%, The Netherlands is 48%).
Traditionally, Northern European households were very frugal and going into debt was seen as shameful (except for the necessity of buying a house). Being profligate was a sin.
Hi Chris, remember asking my Dad when could we upgrade to a colour television. Response: When I can afford it. Credit didn’t really exist in the 1970s, and over recent decades it has increasingly become freely available. The debt/net income ratio has quadrupled in Australia to around 2.0X (and that is just the “average”). Hence, the pain for sharply rising interest rates/ falling house prices. Hopefully unemployment will remain very low.