Are we following Buffett’s lead towards a market crash?
Every day, I am met with articles quoting commentators telling me that the market is high and, therefore, on the precipice of a correction. Let’s get one thing straight – markets don’t fall just because they are high. They can stay high and continue upwards for a long time. It is also a mistake to believe that a catalyst is required to cause the market to crash. Investors, to this day, debate the trigger for the 1987 crash.
So, markets don’t fall just because they are high, but they can fall for no apparent reason.
The trick is not to try and make sense of it but to stick to the framework you have developed for investing. My framework for equity investing is 1) stick to quality quality and quality growth (the latter being organic rather than acquisitive) and 2) be aggressive when value slaps you in the face (note: value can take many shapes).
Right now, the market peers back at a very good rally. The S&P 500 is up 36 per cent in the last 12 months, the S&P SmallCap 600 Index is up 37.50 per cent over the same period, and the All Ordinaries is up 19 per cent.
Figure 1. S&P 500, S&P 600, 17 November 2023 – 15 November 2024
S&P 500
S&P 600 Source: Google.com
Of course, if you have been following this blog, reading my fortnightly articles in the Wealth section of The Australian, or spotted me fortnightly on Ausbiz or on ABC TV and radio, you would know I’ve said many times, that 2024 would be a good year for equities.
Here’s just one example from a February 6, 2024 blog post entitled, How to maximise Your Returns in 2024 and Beyond
And it has indeed been a good year for equities.
The reason for the optimism was twofold: 1) major Western economies would enjoy positive economic growth, and 2) disinflation would remain a feature. Why do those two things matter? Well, since about 1970, whenever the two coexisted, equities did well, especially the equities of innovative businesses with pricing power and whose ability to grow can be faster than the market currently predicts or can be sustained for longer than the market currently anticipates. When growth is quicker or can be sustained for longer than expected, the market tends to re-rate the company, and investors receive a boost from the expansion in the price-to-earnings (P/E) ratio, as well as the gains from the better-than-expected growth in earnings.
And the quality growers are indeed the companies that have done well in 2024.
But after a period of heady gains, some investors become nervous – I know I do.
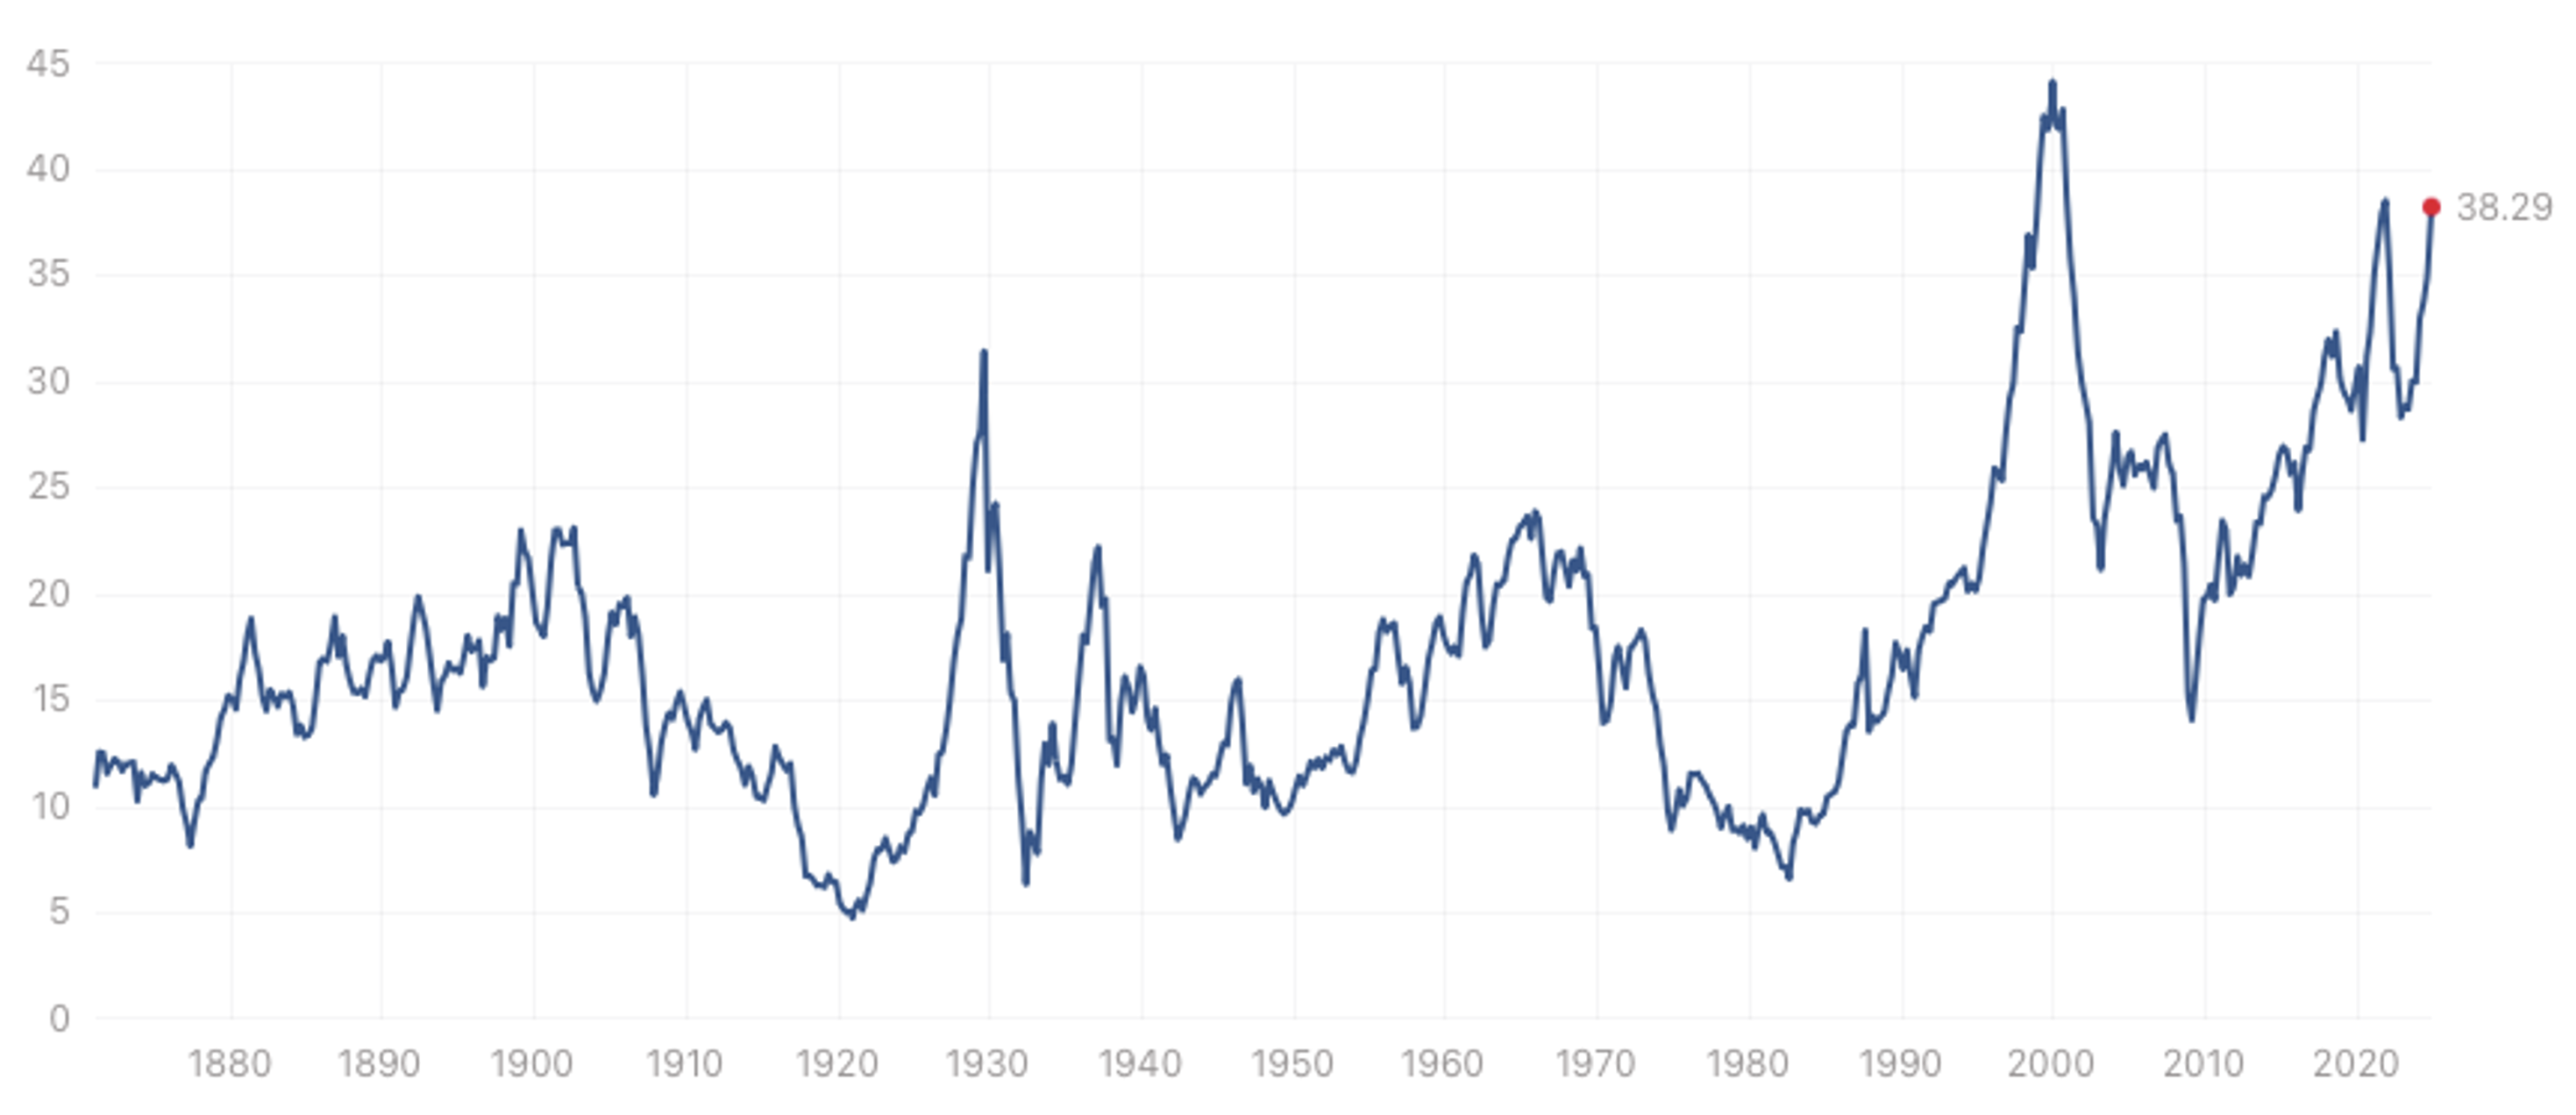
Figure 2., plots the Shiller Cyclically Adjusted P/E (CAPE) Ratio and reveals the ratio is at a level it has only visited four times since 1871.
Figure 2. CAPE Shiller Ratio, 1987-2024
 Source: Multpl.com
Before you go and sell all your equities, keep in mind that the CAPE ratio was last at this level in November 2021. You might have decided to sell stocks, then. If you had, you would have side-stepped a brief 24 per cent decline, but the market has since rallied almost 68 per cent, to now be 30 per cent higher than when the CAPE ratio was last at the current level.
The CAPE ratio is not great for predicting crashes. It has a half-decent track record in its prediction of future returns.
The higher the price you pay, the lower your returns
Robert Shiller’s cyclically adjusted P/E (CAPE) ratio currently points to potentially muted returns, possibly around 0.5 per cent annually after inflation for the next ten years.
Meanwhile, Goldman Sachs and Vanguard have both forecast low returns for large-cap U.S. stocks over the next decade, with expectations hovering around 3-5 per cent annually. I don’t know about you, but I have seen Vanguard and Goldman Sachs get their forecasts very wrong in the past – many times.
Perhaps more worthy of reflection are the moves by Warren Buffett, Todd Combs and Ted Weschler at Berkshire Hathaway (NYSE:BRK.B). Their cautionary actions – holding a US$325 billion cash reserve and paring down positions in key stocks like Apple (NASDAQ:AAPL) and Bank of America (NYSE:BAC) – might give pause to even the most enthusiastic investor.
Should the rest of us follow suit?
As I have noted previously, Buffett’s massive cash position is not without precedent. Over his career, he’s stockpiled cash before two of the market’s most significant declines: in 1969, when he closed his first investment partnership citing “frothy” markets, and before the 2008 financial crisis, when he strategically waited to deploy his capital at more favourable valuations. Considering his track record, some investors see his current cash strategy as a potential signal that the market may be expensive and due for a pullback or correction.
But as I wrote back in August, in The Australian, “Sometimes it’s correct to conclude a rising cash balance at Berkshire Hathaway reflects Buffett’s nervousness about the market’s heady levels but, thanks to the cash-generating nature of the businesses owned by Berkshire Hathaway as well as the limited opportunity to make meaningful acquisitions with such large amounts of cash being produced, the cash balance is frequently reaching a “record”.
“Indeed, Berkshire’s cash balance can reach new record levels quarterly. Clearly, Buffett isn’t predicting a market crash each quarter.”
Nonetheless, while cash at Berkshire Hathaway has been trending up for decades, it has recently accelerated, leading many more commentators to conclude Buffett and his management are forecasting a correction.
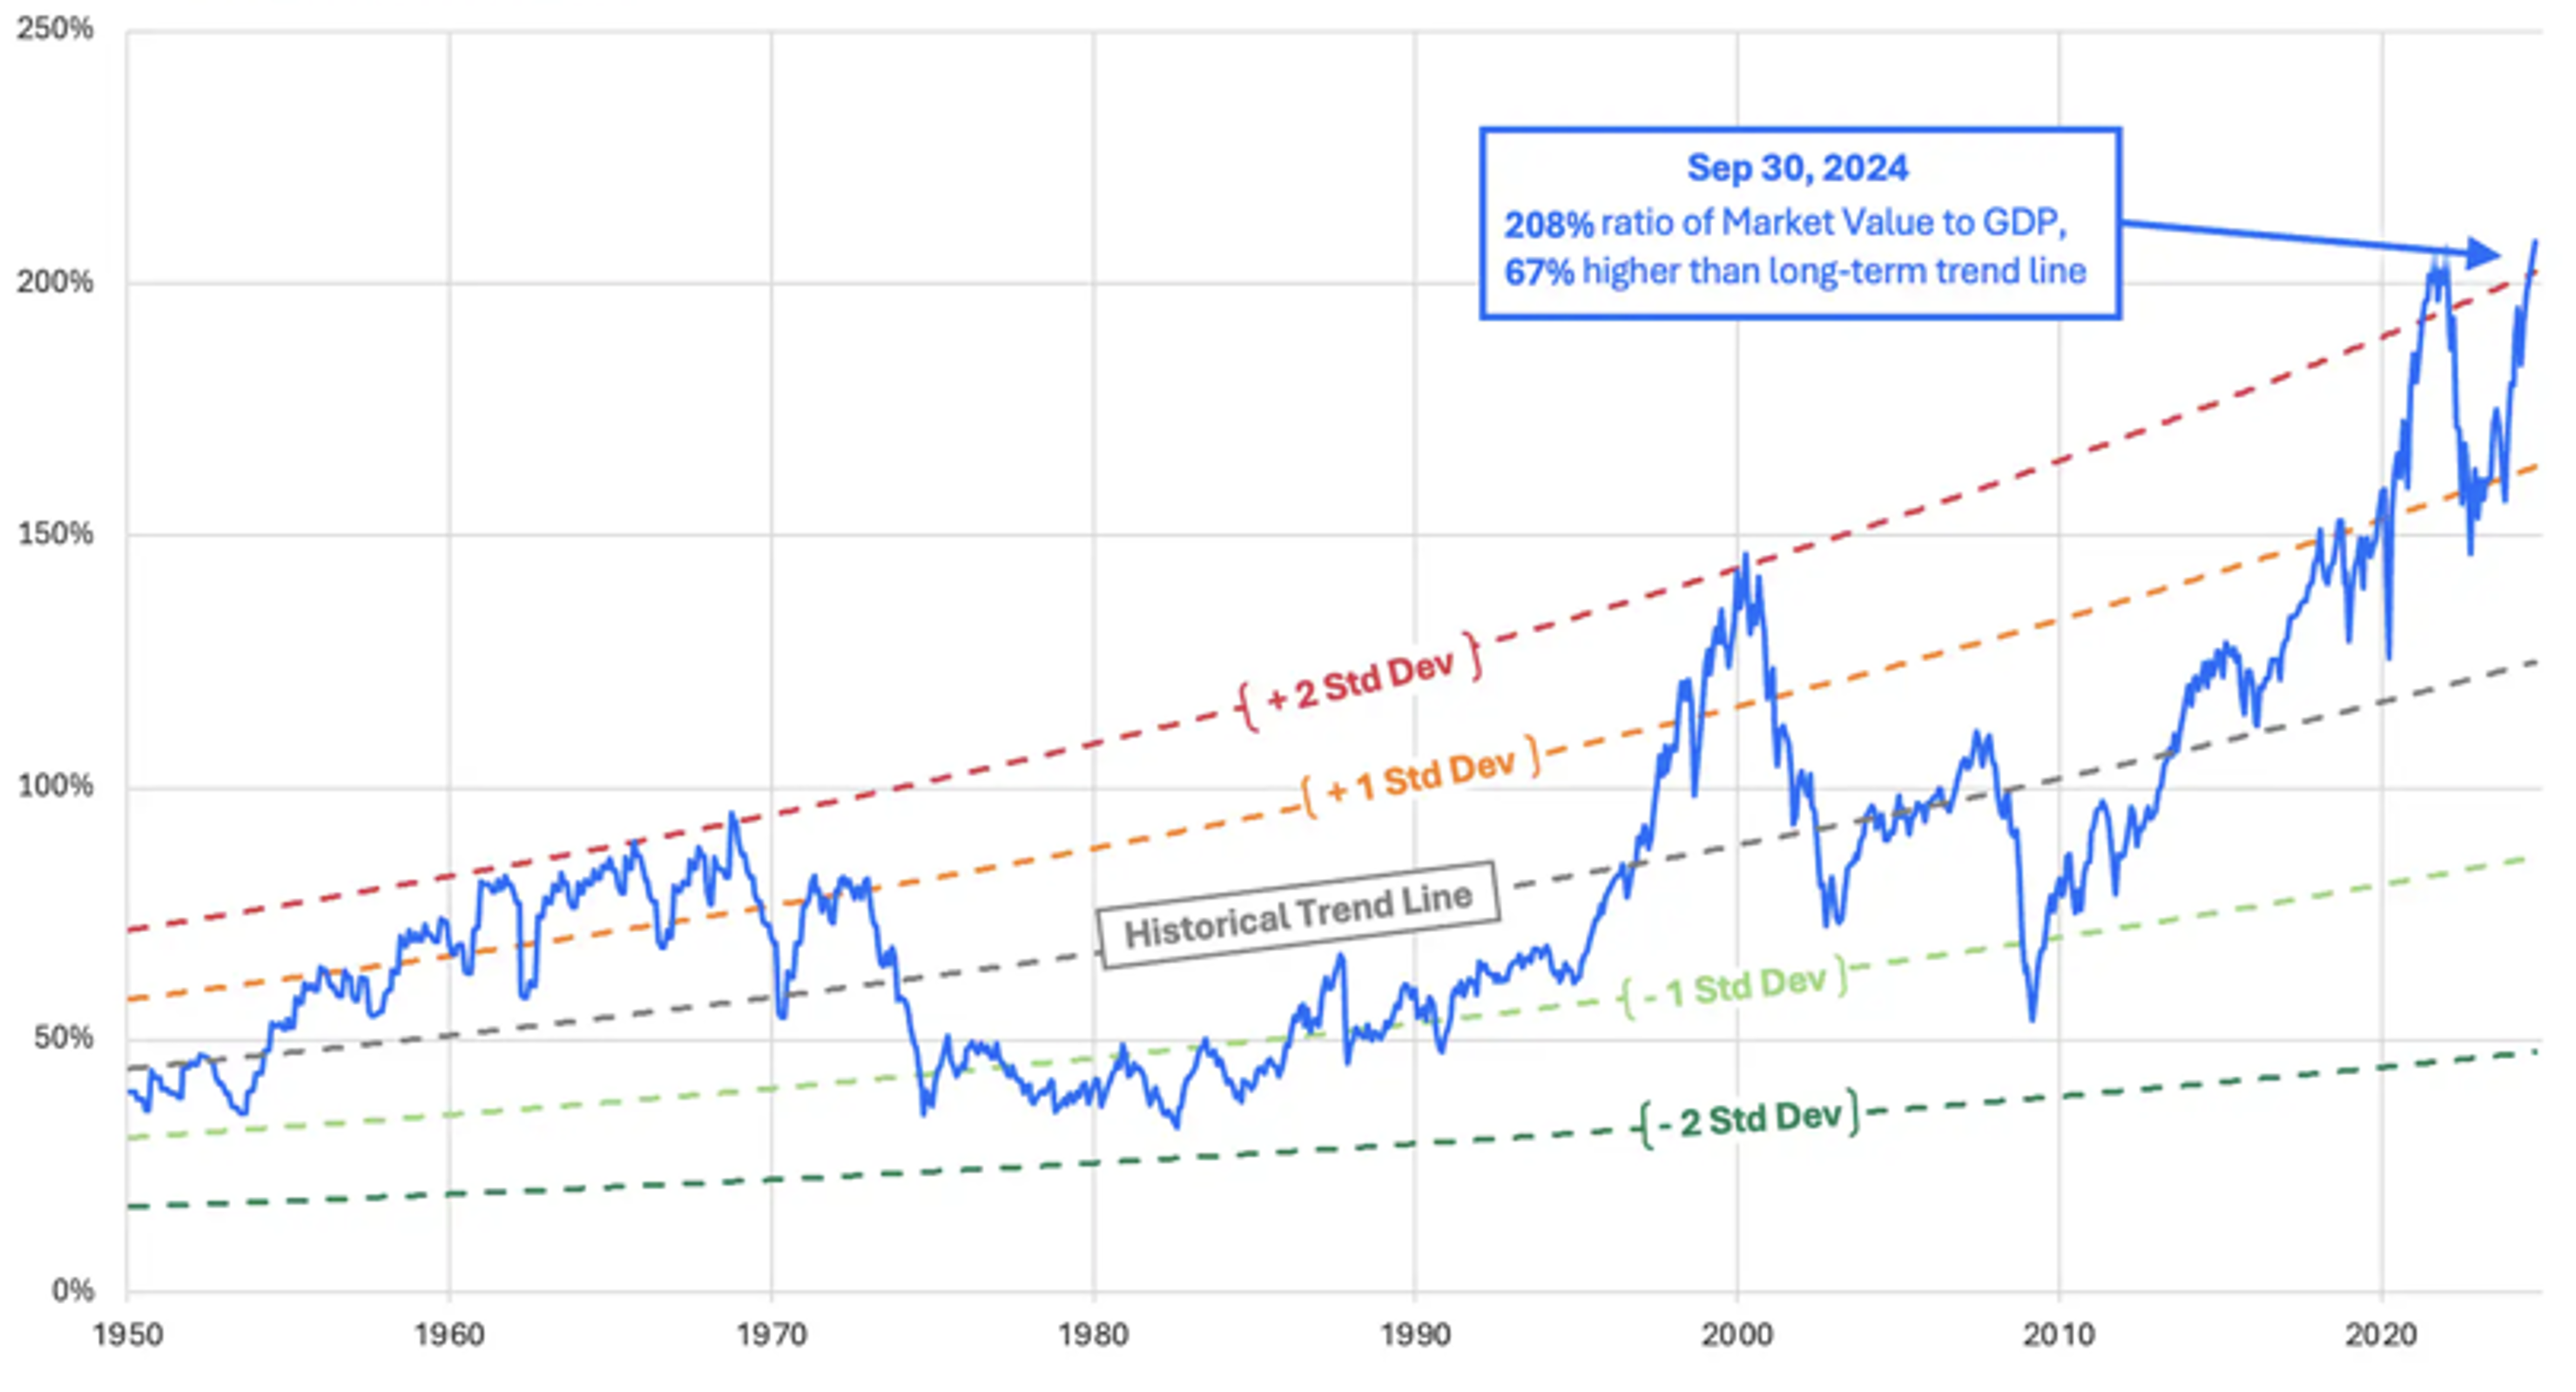
Another indicator many of these commentators rely on is the Buffett Indicator, which Buffett himself once described as “probably the best single measure of where valuations stand at any given moment.” The Buffett Indicator is a ratio of all listed stocks to the size of the U.S. economy. Currently, with the market capitalisation of the U.S. Stock Market at US$61 trillion and annualised U.S. GDP at US$29 trillion, the ratio sits at 210 per cent.
Figure 3., puts that circa 210 per cent into perspective.
Figure 3. The Buffet Indicator, 1950 – 30 September 2024
 Source: Marketvaluation.com
Once again, it is easy to become nervous while examining these charts, but the Buffett Indicator exceeded its 2000 all-time-high in 2018, has pretty much remained high since then and yet, the S&P500 is up nearly 142 per cent since then.
Of course, there can be bumps along the way, but provided you are sticking to quality issues of companies growing as a result of innovation, you will do very well. And anyway, caution can take many forms.
Keep in mind that Berkshire Hathaway is unable to buy small-cap stocks and make any difference to its returns. It’s just too big. Smaller investors, however, can profit where Buffett cannot. And, for what it’s worth, while Vanguard thinks the S&P 500 may only produce very low single-digit returns for the next decade, they are more optimistic about small caps, predicting U.S. small-cap stocks could yield 5-7 per cent annually.
Patience, discipline and perspective
Eventually, one day, the stock market will crash again. You can bet on it. Trying to work out when by studying CAPE and Buffett indicator charts, however, is an unnecessary distraction from the task of identifying high-quality growth companies or the fund managers that invest in them. Stick to that, keep a little cash on the side as an option over lower prices, and in the long run, you’ll do just fine.
Postscript
For what it’s worth, I think the start of 2025 will be as good as 2024 was, but towards the end of 2025, some caution might be warranted.
Nobody can accurately predict what the market is going to do. That said, it is, if nothing else, a stimulating exercise to investigate what the catalysts, if any, could be for a correction.
Xi Jinping’s promise to take back Taiwan
We already know an emboldened China intends to fulfil its imperial and geostrategic objectives through expansionist behaviour against Taiwan, and while military strategists believe the People’s Liberation Army (PLA) will be ready by 2027, intelligence agencies have said that Xi has directed the PLA to be prepared for a potential invasion of Taiwan by 2027.
Debt refinancing
A second possible catalyst is the refinancing of very large amounts of debt adopted during ultra-low and zero interest rates and the consequent demand on liquidity to do it. As Michael Howell of Crossborder Capital wrote in the Financial Times on October 17, 2024;
“If bull markets always climb a wall of worry, then financial crises often smash into a wall of debt. We are already walking into the foothills of another crisis. It is not just the growing size of the interest bill that matters, but more so the task of rolling over a pile of maturing debts. Next year, and particularly 2026, will prove challenging years for investors.
“Consider how, over the coming months, stock prices will not only have to defy growing investor doubts about growth and inflation, but by late 2025, they will have to scale a sizeable maturity wall of debts. This term describes the bunching in the refinancing of those debts mostly taken out a few years back when interest rates were at rock bottom. Similar refinancing tensions have helped trigger several past financial meltdowns such as the 1997-98 Asian crisis and the 2008-09 financial crisis.”
History suggests investors should expect corrections. Indeed, they should look forward to them. For investors with longer horizons, cheaper prices, such as those presented by a crash should be seen as an opportunity to boost returns.
Remember, the lower the price you pay, the higher your returns.