Are small caps finally taking off?
Back in July, I wrote about the historically large gap between large and small-cap companies, noting that the extremely narrow rally in the largest technology companies, now more commonly referred to as the Magnificent Seven, resulted in many smaller caps being relatively undervalued. The highest-quality names with earnings growth may present a compelling opportunity, especially if professional investors conclude the macroeconomic and interest-rate backdrop is supportive.
Following that July blog post however, U.S. 10-year treasury bond yields rose from 3.857 per cent to five per cent in October. Understandably, the Russell 2000 small cap index fell about 16.5 per cent over the same period, and the S&P 600 Small Cap index declined 15.4 per cent. Our domestic ‘Small Ordinaries’ Index fell 10.9 per cent over the same period.
Since the end of October, an unmitigated shift in sentiment has occurred. The U.S. 10-year treasury bond yield has fallen from 4.98 per cent to 4.22 per cent on the back of a range of economic indicators revealing a slowing U.S. economy. With unemployment rising to 3.9 per cent – a 21-month high – and with indicators including leading economic indicators (LEI), purchasing managers’ index’s (PMI), yield curve, gross domestic income (GDI), tax revenues, corporate profits, money supply, the savings rate, intermodal rail, and home affordability, appearing to be in recession already, recent trends suggest a diminishing impact from U.S. fiscal stimulus as well as a diminishing need for further interest rate increases.
Importantly, lower inflation expectations alongside growing optimism that central bank rate hikes may have peaked saw two-and-10 year U.S. yields down 35 basis points and 55 basis points, respectively, in November alone.
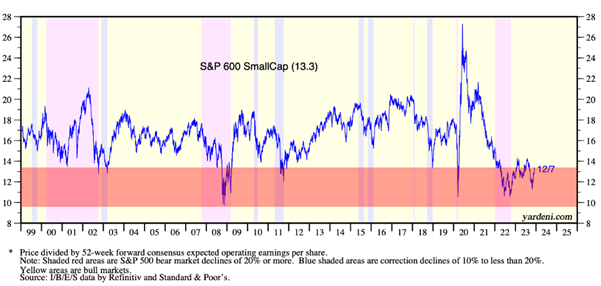
As Figure 1., reveals, the S&P600 SmallCap Index 1 year forward price earnings (P/E) ratio now stands at 13.3 times, and in the last quarter century, has only been lower at the depths of the 2022 PE compression, the COVID-19 sell-off and the great financial crisis (GFC).
Figure 1. S&P500 PE Ratio. 1999 – 2023

More compelling, however, is the optimism that has accompanied a covering of short positions by hedge funds who were reportedly hitherto short the junkier end of the stock market.
Locally, The S&P/ASX 300 Accumulation Index posted its largest monthly gain in 2023 of five per cent in November. The gains were broad-based, with the largest gains coming from those sectors that had previously underperformed. Health care and real estate were the best-performing sectors for the month, up 11.7 per cent and 10.8 per cent respectively. But it was the bounce in small caps that took the spotlight. Small caps outperformed large and mid caps, rising 7.0 per cent in total return terms with small cap health care stocks up 16.6 per cent in aggregate for the month and Technology stocks rising 12 per cent.
It suggests that at least investors are open to adopting risk again. This flies in the face of conventional wisdom. History suggests the period immediately following a cycle of interest rate increases is notoriously difficult to navigate. Higher rates increase required returns, dampen present values, inhibit economic activity, and increase finance costs. Some investors suggest this combined with relatively high P/E multiples means the outlook for equities is probably skewed to the downside.
I am unsure if that’s the case because I cannot concur that P/E ratios are relatively high. As Figure 1. reveals, P/E ratios for small caps, for example, aren’t high, at least relative to recent history.
According to T. Rowe Price, U.S. small caps have “generally led the market recovery following a recession, often outperforming larger companies over multiple years”. Schroders reveals that “small-cap stocks saw a 9.9 per cent annualised net total return during “recession and recovery” periods over a nearly 40-year period that included numerous recessions, including the global downturn of 2007/2008. Large-cap stocks saw average returns of 4.9 per cent over the same period.”
Of course, if you accept that these statistics will change in the future, then by definition, future results will differ, perhaps significantly. Nevertheless, it’s worth reflecting on the opportunity amid fears of a recession that some, like JP Morgan, say is not a matter of ‘if’ but ‘when’.
On Tuesday, November 14, 2023 – when the Russell 2000 jumped 5.44 per cent in a single day and the S&P600 5.47 per cent – investors demonstrated their willingness to absorb good news concerning declining bond rates rapidly. The lesson for investors is that it may seem safe to stand aside, and out of small-cap equities when the future is uncertain. The reality however is that waiting for good news to be confirmed could be a very expensive mistake. And what cannot be predicted is when sentiment changes. This can happen way ahead of confirmatory economic data. In that latter case, investors who stand aside will be very late to the party indeed.