A review of markets in 2020
With 2020 almost now behind us, I thought it was worthwhile looking at the year that was. It’s safe to say this year is unlikely to be forgotten for everyone, and not just those invested in equity markets. After a very strong January, investors and markets grappled with the uncertainty and severe volatility brought upon by COVID-19’s spread around the world.
Many historic records were set and broken, with March being particularly noteworthy for swings in sentiment including:
- A 9.5 per cent fall on 16 March, the biggest one-day fall since 1987.
- 13 of 22 days registering more than 3 per cent moves in either direction on the previous close.
- An intra-day swing of 13.5 per cent on 13 March – down 8.5 per cent at one point, only to reverse course to close 4.3 per cent higher for the day.
We also had a very strong rebound in April as central banks unleashed liquidity to prevent a financial meltdown, while governments looked to support households with unprecedented budget deficits.
Other notable developments in 2020 include:
- Negative oil prices – with WTI bottoming at -$37/bbl.
- The “bankruptcy” trade – with the share prices of companies like Hertz (more than 1000 per cent in 2 weeks), JC Penney (more than 200 per cent in 3 days) and Chesapeake Energy spiking higher after filing, or notifying of intentions to file for Chapter 11 (US Bankruptcy protection) largely driven by “RobinHood” or retail stay-at-home traders.
- Historic US jobless claims – with the 6.9 million initial jobless claims filed 27 March more than 10 times the number of 665,000 set on 27 March 2009 in the depths of the GFC (the prior post 1990 record).
- The rise of e-commerce – with the likes of Kogan (+140 per cent), Temple and Webster (+261 per cent) and Redbubble (+431 per cent) recording an acceleration of growth and structural trends.
There was also an enormous level of corporate activity, as companies looked to shore up their balance sheets while a number of companies looked to capitalise on elevated liquidity by listing their businesses on the ASX.
Australian 10-year bond yields – having started off the year at approximately 1.4 per cent, leaves 2020 at around 1 per cent albeit after bottoming out at 61 basis points in the depths of the COVID-19 crisis. It remains to be seen whether 10-year bond yields stage a recovery as growth expectations improve following a year “on-pause” due to COVID-19.
In terms of aggregate PEs, we have:
- 1 year forward PE at Dec-19 – 20.2x
- 1 year forward PE at Dec-20 – 22.4x
Albeit the composition is vastly different, as the financials (mostly banks) trade at a significant discount to the broader industrials market, as does resources.
Market movers
In terms of index constituents, here are some of the moves seen over 2020:
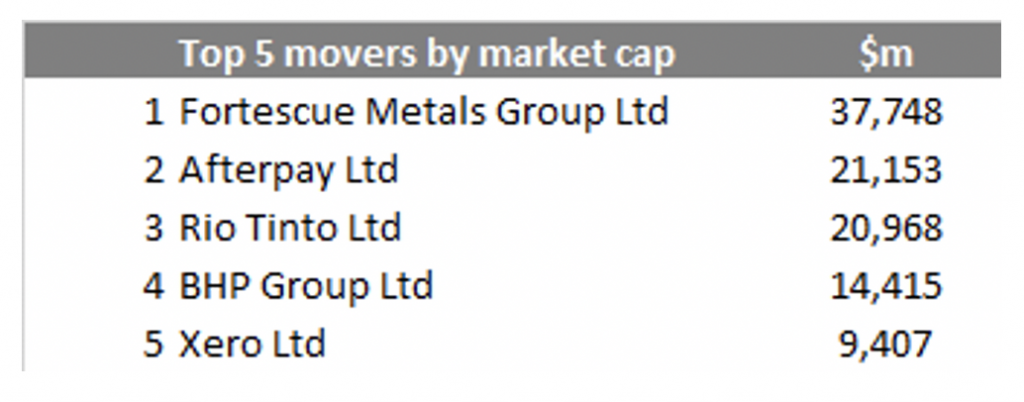
- Top 5 movers by market capitalisation
Source: Bloomberg, MIM
The top movers this year have largely been the miners, as well as some large-cap tech. After starting the year off as laggards (given the initial wide-spread impact of Coronavirus was in China), the large-cap miners have posted strong returns due to a much stronger iron ore price than expected as the Chinese government has reverted back to Fixed-Asset investment to restimulate the economy post the COVID induced slowdown, and some minor supply disruptions helps already bullish sentiment.
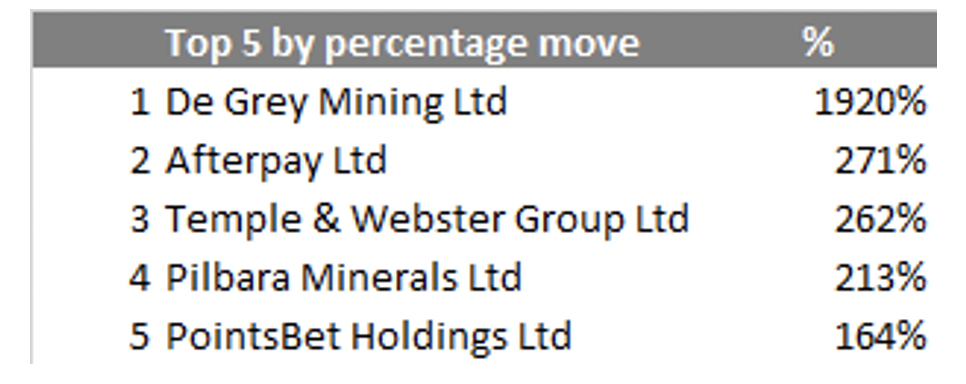
- Top 5 movers by percentage
Source: Bloomberg, MIM
The top mover for 2020 is De Grey Mining, which entered the ASX300 in September following a meteoric share price rise driven by exploration success at its Hemi Gold project in Western Australia. Afterpay is next on the list, albeit its 271 per cent return does little justice to its share price journey over the year.
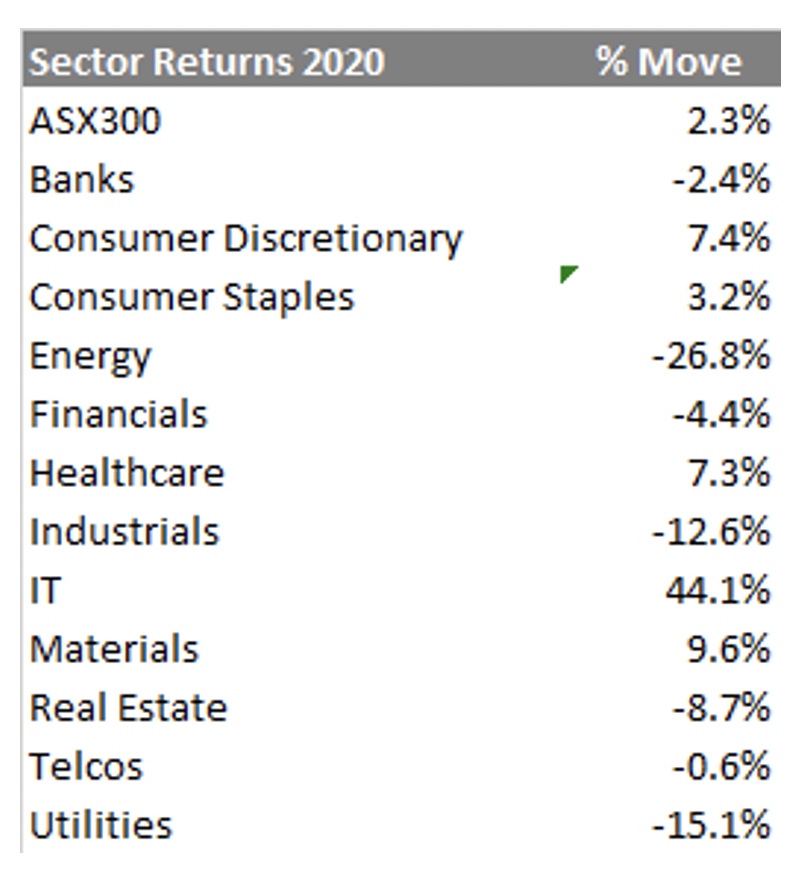
- In terms of the sector performance
Source: Bloomberg, MIM
- Best GICS sector performance – IT at 44.1 per cent
Like Healthcare and CSL in 2019, the outperformance of the IT sector was largely driven by the two heavyweights Afterpay and Xero.
- Worst GICS sector performance – Energy -26.8 per cent
One of the worst impacted sectors resulting from COVID has been the energy sector, as supply cuts have been unable to offset the significant decline in oil demand due to a reduction in travel (cars, aircraft).
This post was contributed by a representative of Montgomery Investment Management Pty Limited (AFSL No. 354564). The principal purpose of this post is to provide factual information and not provide financial product advice. Additionally, the information provided is not intended to provide any recommendation or opinion about any financial product. Any commentary and statements of opinion however may contain general advice only that is prepared without taking into account your personal objectives, financial circumstances or needs. Because of this, before acting on any of the information provided, you should always consider its appropriateness in light of your personal objectives, financial circumstances and needs and should consider seeking independent advice from a financial advisor if necessary before making any decisions. This post specifically excludes personal advice.
INVEST WITH MONTGOMERY

