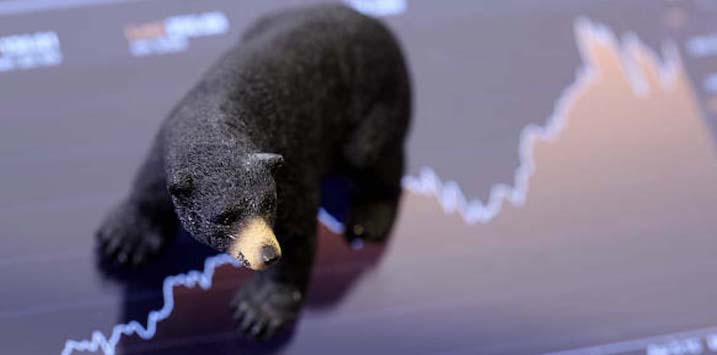
A “pullback” or a “serious bear market”?
Over the past five decades the share-market, as measured by the US S&P 500 Index, has recorded 24 “pullbacks” exceeding ten percentage points. On six of these occasions, or one in four of the “pullbacks”, we have witnessed a “serious bear market”, or a decline exceeding 25 per cent, as illustrated in the table below.
Of the six “serious bear markets” recorded in the past five decades, the average decline has been 42 per cent, and the average duration has been 18 months.
| Period (by years) | Number of Days | Percentage Decline |
| 1969-1970 | 537 | -36% |
| 1973-1974 | 622 | -48% |
| 1981-1982 | 614 | -27% |
| 1987 | 99 | -34% |
| 2000-2002 | 915 | -49% |
| 2007-2008 | 510 | -57% |
| AVERAGE of the Big 6 | 550 (or 18 months) | -42% |
In simple terms, we witness a “pullback” exceeding 10 per cent around every two years, and a “serious bear market”, on average, every eight years. Given 75 per cent of the pullbacks, are just that, many investors have historically used the odds to react accordingly, by adding spare cash to the market.
When we see the markets break down into a “serious bear market”, investors fear drives net selling which generally accentuates the downward move. Net selling near the bottom is a costly exercise, as investors miss the rebound, and a new bull market can begin as abruptly as an old one ends.
The Global Financial Crisis is a case in point, where the S&P 500 after a “serious bear market” lasting around 18 months to March 2009 bottomed at 700 points. The ensuing bull market over the next nine and half years (to September 2018) jumped to above 2,900 points, delivering investors a compound annual average return (excluding dividends) of 16.3 per cent.
Rather than giving readers a lot of data points on why the recent pullback may or may not turn into a “serious bear market”, I thought it better to quote my colleague, Tim Kelley as follows “The obvious question now is Where to next? but, as always, we are unable to offer any reliable insight into whether the market may rebound or continue to decline in the months ahead. Nor can we point to anyone who we think does have this insight. Statistically speaking, sudden declines of this sort are more common than all out market catastrophes. However, the short-term behaviour of the market is extremely difficult to forecast”.
Chief Executive Officer of Montgomery Investment Management, David Buckland has over 40 years of industry experience.
David is a deeply knowledgeable and highly experienced financial services executive. Prior to joining Montgomery in 2012, David was CEO and Executive Director of Hunter Hall for 11 years, as well as a Director at JP Morgan in Sydney and London for eight years.
This post was contributed by a representative of Montgomery Investment Management Pty Limited (AFSL No. 354564). The principal purpose of this post is to provide factual information and not provide financial product advice. Additionally, the information provided is not intended to provide any recommendation or opinion about any financial product. Any commentary and statements of opinion however may contain general advice only that is prepared without taking into account your personal objectives, financial circumstances or needs. Because of this, before acting on any of the information provided, you should always consider its appropriateness in light of your personal objectives, financial circumstances and needs and should consider seeking independent advice from a financial advisor if necessary before making any decisions. This post specifically excludes personal advice.