
Happy Birthday SVM
Alert readers will recall that back in June 2014 we started an exercise to explore the merits of using machine learning technology to sift through the equity markets and identify stocks that are likely to do well or poorly in the future. The most recent instalment in the series can be found here.
By way of recap, we “trained” a machine learning algorithm called a Support Vector Machine (SVM) to identify winners and losers, and having trained it, we set it loose in June on the ASX 300 to see what it would select as the best and worst investment candidates. We said at the time that we would follow the machine’s selections for a year to see how it performed.
The first six months provided some cause for stress among we human analysts, as the machine’s selections had a dream run. The top 20 portfolio chosen by the SVM outperformed the market by an average of 8.0 per cent, and the bottom 20 portfolio underperformed by an impressive 13.8 per cent. At this rate, it was starting to look as though machines should do all the work, and analysts might need to cultivate a broader range of interests.
Six months, however, is not long in investment markets, and the machines’ dream run did not continue. In the 6 months since our last update, the performance of the portfolios looks like this:
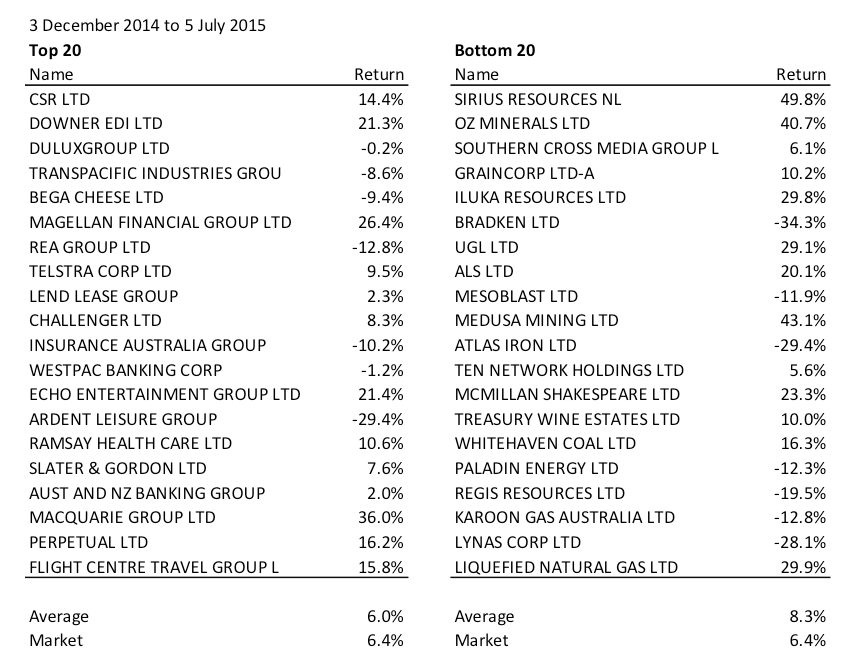 As you can see, the top 20 stocks basically tracked the market, and the bottom 20 outperformed the market slightly, when they should have underperformed. On the short side, the machine got its fingers singed when a number of slightly dubious resources companies staged spectacular share price rallies.
While the most recent six months was uninspiring, the performance of the SVM over the full 12 months remains impressive. On the long side it delivered outperformance of more than 7 per cent, and on the short side it delivered outperformance of almost 12 per cent. These are figures that most fund managers would be very happy with.
Happily, it turns out that The Montgomery Fund did better than the machine top 20 over this same period, delivering outperformance of almost 9 per cent after all expenses. On this basis, we’re going to call this one as a win for the humans.
It is probably also fair to note, however, that this was an above-average period for The Montgomery Fund. From the date of inception up to the time of writing, The Fund has delivered compound outperformance after all expenses of between 5 and 6 per cent p.a. So, we’ll call this year a win for the humans, but we might also take the opportunity to quit while we’re ahead.
We’ll also be looking over the machine’s shoulder in the future, with a view to stealing any good ideas it finds.
Perhaps the most useful lesson to draw from this is the role played by luck and noise in determining short-term investment results. If you evaluated the SVM on its first 6 months it looked like a genius; on its second 6 months it looked like a dud.
Similarly, the Montgomery Fund has had a spectacular run in the last 12 months, but the previous year it underperformed its benchmark. The point is that a good investment strategy will always have stretches of weak performance, and investors need to be able to tolerate these periods in order to get the best from a strategy. One of the most damaging things an investor can do is look at a short term period of weakness and think “I need to change something”.
If the strategy is sound, it is probably the investor that needs to change. Rather than looking at your investments weekly, monthly, or even quarterly, maybe your time could be better spent elsewhere.
Opening a meditation studio for stressed investment analysts, perhaps?
Tim Kelley is Montgomery’s Head of Research and the Portfolio Manager of The Montgomery Fund. To learn more about our funds please click here.
Tim joined Montgomery in July 2012 and is a senior member of the investment team. Prior to this, Tim was an Executive Director in the corporate advisory division of Gresham Partners, where he worked for 17 years. Tim focuses on quant investing and market-neutral strategies.
This post was contributed by a representative of Montgomery Investment Management Pty Limited (AFSL No. 354564). The principal purpose of this post is to provide factual information and not provide financial product advice. Additionally, the information provided is not intended to provide any recommendation or opinion about any financial product. Any commentary and statements of opinion however may contain general advice only that is prepared without taking into account your personal objectives, financial circumstances or needs. Because of this, before acting on any of the information provided, you should always consider its appropriateness in light of your personal objectives, financial circumstances and needs and should consider seeking independent advice from a financial advisor if necessary before making any decisions. This post specifically excludes personal advice.
Did the machine just pick and hold? It would be interesting to know how many of the stocks dropped out of the top 20 at the 6 and 12 month marks.
Also, was each stock given an equal weighting? Could the machine be trained to hold more of one stock than another? And would that improve the returns?
Hi Benjamin,
We allowed the machine to turn over 25% of the portfolio half way through the year. We would expect more rebalancing should improve performance, but at the expense of higher trading costs. As to portfolio construction, it is certainly possible to construct an ‘optimal’ portfolio, taking account of the machine’s predictions, as well as volatility and correlation between stocks. This approach should reduce risk, and might have helped the ‘bottom 20’ portfolio in the last 6 months by reducing its tilt to resources.
Shouldn’t the sample period be 3 December 2014 to 5 June 2014 rather than 5 July 2015?
Well spotted, Justin, although it should be June 2015, rather than June 2014.
It will be interesting to run the same test when you get your hands on AZK’s “Brainchip”