
Mean reversion
A lot has been written about the woes of the resources sector recently with a similar amount of energy spent trying to work out when is the right time to expect ‘mean reversion’. A simple theory that although sounds complex, really just suggests that prices and returns eventually move back towards the mean or average as time periods are extended. Given the resource sector has been a material underperformer of late, the theory suggests you should reallocate a portion of your portfolio to such businesses in the expectation (or hope) that if such an event occurs, recent underperformance will lead to outperformance.
Sounds good in theory.
Long-term followers however would know all too well that we have had very little exposure to resources and resource services companies and looking forward, our positioning is unlikely to change materially even if such an event was a probable one. Why? Well, even while resource-like businesses still do represent a fair share of the Australian Stock Exchange, both by number and market capitalisation, the reason why we prefer to avoid investments in this area is pretty simple: we seek to own high quality businesses with bright prospects. A key feature of a quality business is an ability to control the product(s) they sell and also the prices they charge to their clients.
In our experience, resource-like companies are almost the polar opposite of this. Their prospects are often hard to lock down with any certainty given they are highly cyclical businesses and they cannot control the prices for their production. At all points in the cycle from a buyers perspective, it doesn’t matter where you buy your [copper, gold, iron ore, oil, gas] from, it’s all the same stuff. Ultimately the buyer just wants the raw input to turn into other products as cheaply as possible. That’s not attractive from a business economic perspective.
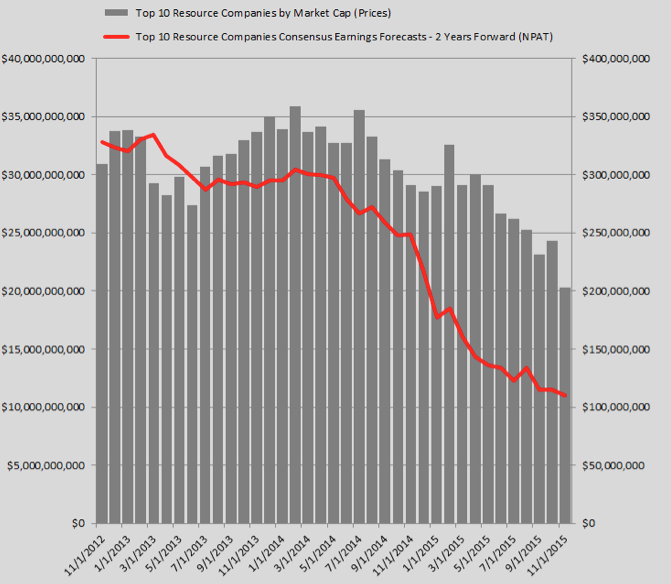
To put our view into another perspective, let’s say today you are offered the opportunity to buy a 10 stock portfolio of the largest, most well-known resource-like businesses on the Australian Stock Exchange for $203 billion. These businesses in 2017 are expected to generate $11 billion in after-tax earnings and those quick with numbers will observe that this implies a lofty but not excessive price to earnings ratio of 18.41 times future earnings ‘estimates.’
For that sort of multiple, you would expect to see a decent amount of historical growth as evidence that your portfolio of 10 business will be able to grow in the future. This is important given one would need evidence that your portfolio has a real opportunity to grow into its above markets average pricing / valuation. The average business on the ASX currently carries a multiple of circa 15 times forward earnings to put this into relative perspective.
Let’s say that you now go back in time to the end of 2012 where you discover that this same group of resource-like businesses were then forecast to make $32.8 billion after-tax earnings. After you reconcile that, with the $11 billion forecast today, you would notice that in between these two figures there is a clear trend of lower forecast profits (which continues to fall to this day), not higher. And given its a well established trend, its highly likely that this will continue. On that basis, you’d be a bit mad to take up the opportunity wouldn’t you?
Armed with this knowledge, unless you had a very good reason to expect the fortunes of this group of businesses to turn around, and soon, a multiple in excess of 18 times earnings could not be justified. You, like us, would simply move onto the next opportunity.
No, i’m not making this up! That’s exactly the situation facing investors who hold some of the top 10 resource companies on the ASX including the likes of BHP and Rio Tinto. All we have done is gone back in time and looked at the trend in the 2 Year Forward Consensus Analyst Net Profit After Tax estimates (red line), measured on a monthly basis. On top, we have graphed this against their respective tmarket capitalisations (grey bars) and as shown below, it’s not a pretty picture:
Our conclusion on this is pretty simple. Whilst others may wish to try and pick the bottom of the cycle, our view today is the same as it was back in 2012/2013. At a minimum, until we begin to witness an expectation that earnings for the sector are looking like they will recover and again grow, at 18.41 times the risk to our clients capital of further losses is just too high in the face of persistent negative earnings revisions (for this group of 10) given continued poor outlooks for commodity prices. There are simply better opportunities elsewhere.
Given their highly cyclical nature, earnings for resource focused companies and thus their market capitalisations (remember in the long-term share prices / business valuations tend to have a high correlation to the earnings power of the business), have done little other than been highly volatile. When you consider this fact, there is a clear explanation as to why share prices for many resource companies are today the same or lower than they were 10 years ago.
Indeed perhaps this is the only mean reversion that was due to present itself after a decade long-run of out-performance pre 2012.
Russell Muldoon is the Portfolio Manager of The Montgomery [Private] Fund. To invest with Montgomery domestically and globally, find out more.
This post was contributed by a representative of Montgomery Investment Management Pty Limited (AFSL No. 354564). The principal purpose of this post is to provide factual information and not provide financial product advice. Additionally, the information provided is not intended to provide any recommendation or opinion about any financial product. Any commentary and statements of opinion however may contain general advice only that is prepared without taking into account your personal objectives, financial circumstances or needs. Because of this, before acting on any of the information provided, you should always consider its appropriateness in light of your personal objectives, financial circumstances and needs and should consider seeking independent advice from a financial advisor if necessary before making any decisions. This post specifically excludes personal advice.
INVEST WITH MONTGOMERY
I am with Simon, would really appreciate a chart over various cycles if you had an opportunity to prepare one.
Is there any realistic price The Montgomery Fund would invest in resources and agriculture companies? These sectors attract massive amounts of capital which by the Montgomery Funds ethos are perpetually overvalued. It seems like if all fund managers took your stance there would be no investment in this sector. Would you then support a policy of state owned resource companies which could be operated by private companies? I would think the Norwegians have got it right on this one. And quite frankly it seems like a no brainer when one sees what they’ve achieved with their resources windfall compared to Australia.
They sure do (attract massive amounts of capital) and because of that, returns naturally gravitate one way – down.
Its not a space that generally interests us, even if from time to time they do have purple patches and yes, not all fund managers and capital allocators do take our stance.
I dont agree with your comment that just because we dont invest into the sector (we like a return on our capital!) that state-controlled enterprises might be an option. That would be a terrible outcome. The market is broad enough and interests varied so we are fine with others allocating dollars into assets they perceive to be higher quality than us (others taking a different view). And thats what makes a market, investors all doing different things and setting pricing / returns.
Very interesting chart, Have you checked for disparity in the concensus? It would also be interesting to look at historical correlation, by plotting this chart, but over several cycles.
That may shed some form of light on when to expect market caps to rise in aggregate, and thus allow for a better timing. (if one believe in such things)
Do you in general keep away from mining stocks because they lack pricing power or because they are cyclical, or maybe both?
Hi Simon, many of top10 resource like companies have in excess of 15 analysts providing their forecasts, of which I have taken the mean. So I think from that perspective, the figures are solid. I agree charting over longer-term provides more information. Ill prepare one when I have a chance. In regards to your last question, those are certainly issues as well as their capital intensity which almost always ensures we look elsewhere for opportunities.
Sounds like this sector would be on the radar of the Montaka fund. Is this an example of “divergent expectations”?
Hi Luke, not sure about divergent expectations. Definitely however a sector thats been a fruitful one for those with the ability to invest (from the short-side) in businesses with poor future prospects.