
How is The Machine going?
Back in June, we posted series of articles exploring the application of pattern recognition technology in identifying good and bad equity investments.
By way of quick recap, we co-opted a machine learning model called a Support Vector Machine (SVM), and fed it a large amount of historical financial information on ASX-listed companies. The idea was that by “learning” what separated good investments from bad ones, the SVM could then make predictions about what companies might deliver good returns in the future.
In Part 1 we set out the concept; in Part 2 we looked at some of the factors the SVM thought were important in choosing investments; and in Part 3 and Part 4 we set out the top 20 and bottom 20 investments identified by the machine.
To properly assess performance, we need to let the investment ideas run for a reasonable period of time, and in June we thought a 1 year timeframe would be sensible. Since then, a little over four months has passed, and so it’s too early to determine success or failure, but we thought we’d check in on progress to date.
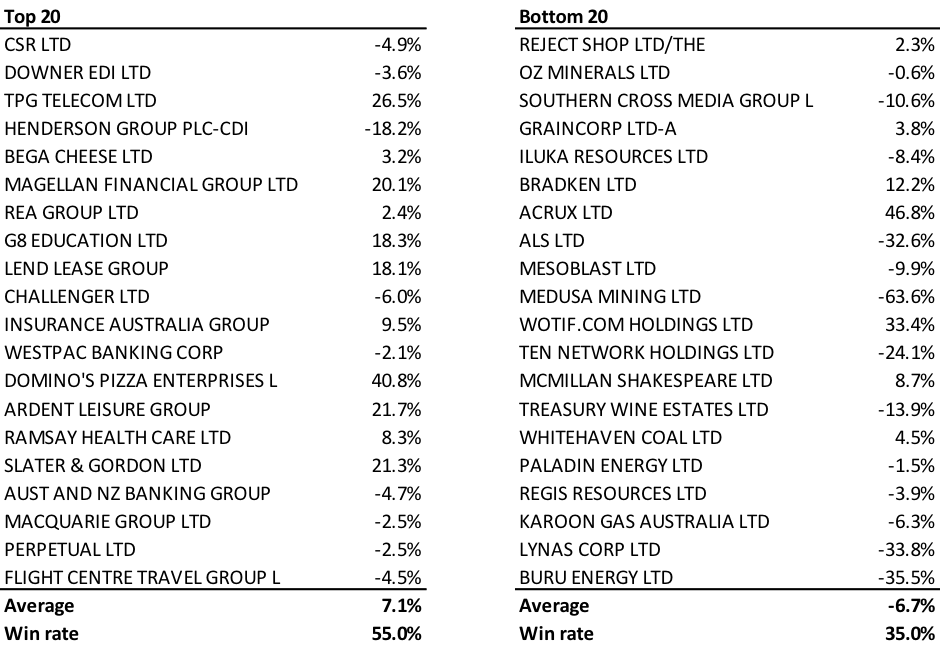
The table below shows the total return delivered by the SVM portfolio companies up to 20 October. As you would expect, there are some winners and losers on both sides. However, it does look like the machine is off to a very good start.
We human analysts may need to keep on our toes.
For the SVM top 20, the average return is 7.1 per cent, and 55 per cent of top 20 companies have outperformed the ASX 200 Accumulation Index, which has returned -0.15 per cent for the same period.
For the SVM bottom 20, the average return is -6.7 per cent, and only 35 per cent of bottom 20 companies have managed to beat the index.
These numbers are a bit surprising – 7 per cent outperformance in a little over 4 months is towards the silly end of the spectrum, and we have to expect more modest results over a longer timeframe. However, even if it achieves zero outperformance over the next 8 months, the SVM will have turned in a good year.
I, for one, welcome our new machine overlords.
Total Returns to 20 October 2014
Tim joined Montgomery in July 2012 and is a senior member of the investment team. Prior to this, Tim was an Executive Director in the corporate advisory division of Gresham Partners, where he worked for 17 years. Tim focuses on quant investing and market-neutral strategies.
This post was contributed by a representative of Montgomery Investment Management Pty Limited (AFSL No. 354564). The principal purpose of this post is to provide factual information and not provide financial product advice. Additionally, the information provided is not intended to provide any recommendation or opinion about any financial product. Any commentary and statements of opinion however may contain general advice only that is prepared without taking into account your personal objectives, financial circumstances or needs. Because of this, before acting on any of the information provided, you should always consider its appropriateness in light of your personal objectives, financial circumstances and needs and should consider seeking independent advice from a financial advisor if necessary before making any decisions. This post specifically excludes personal advice.
Patrick Poke
:
As you said, it’s too early to say much now, but if it can continue to perform this well I might have to consider a different field to study!
Also keep the Simpsons references coming! haha.
Colin Petersen
:
The “win rate” for the bottom 20 should be 65% rather than 35%, shouldn’t it? Since picking stocks that under-perform in a ‘bottom 20’ is a predictive success rather than a failure.
Andrew Legget
:
Thanks for the update Tim. Both sides have a diverse and interesting mix of companies. It will be interesting to see what the 1 yr results are like.
I am really interested in hearing about what people are finding due to activities like the one you are performing and i appreciate the updates. I know not to read to much into things and that it will take a while to get a clear picture as to the value created (i have seen output of a regression basically stating that the output of Woodside petroleum is a statistically significant predictor of sales at David Jones). There is always, however, a chance that you guys find something which is really relevant and powerful as well.
I think persoally the important thing is to keep the big picture in mind which i am sure that you always do.
gareth hurst
:
Hello Andrew,
I am interested to know who published /made available the results of the Woodside/David Jones regression? I would have thought that putting the level of output and sales in a regression would induce spurious results due to the use of data that follows a trend (issues around non-stationary data).
Gareth
Andrew Legget
:
It was nothng official. Just part of a financial forecasting subject at university trying to drum into the fact correlation doesn’t equal causation and that we should always look into things further than simply trusting a regression output.
Similar to the studies that found superbowl winners as a predictor of sharemarkets along with many other examples of computers finding patterns which didn’t actually exist.