
Bank Earnings and Provisions
The market has become increasingly concerned about the risk of asset impairments for the major banks. Whether it be from exposure to Asia, mining and energy assets, agriculture assets in New Zealand, or the housing market in Sydney and Melbourne. Banks have effectively sold a put option to consumers and businesses over their assets or income streams and as a result they have a leveraged exposure to significant falls in asset prices.
From an accounting perspective, the banks accrue charges in their income statements to reflect any expected or potential deterioration in value of their loans. The bank will raise and utilise provisions for bad debts on a specific basis (ie when it can identify an individual loan that is likely to be impaired) or on a collective basis.
The major banks’ earnings growth rates have benefited from falling bad and doubtful debt provisioning over the last 4 years. As a result, the provision charges in the 2015 financial year results were significantly lower than the long term averages for the industry.
This is the result of two factors. First the level of specific impairments has remained low due to the relatively benign conditions. New specific provisions as a percentage of credit risk weighted assets has fallen for each of the major banks. However, this is set to increase over the coming years. ANZ in particular is expected to see a jump in new specific provisions in the 2016 financial year (FY26).
As WBC stated a couple of weeks ago, its provision charges in FY16 swing on roughly 5 specific exposures. Of particular note at the moment is Arrium, to which all of the major banks have some exposure. Arrium has A$2.8 billion of debt. The banks rejected a proposal from a vulture fund to receive 55 per cent of the value of this debt. Instead they are looking to lend a further A$400 million on a secured basis in order to move themselves up the order of seniority.
Other notable exposures are Dick Smith (NAB), Slater & Gordon (NAB, WBC) and Peabody (ANZ, NAB, WBC).
The history of the new specific loan provisions raised each year as a percentage of credit risk weighted assets (CRWA) for ANZ, CBA and WBC is shown below. Note we have compared the provisions raised to the credit risk weighted assets in the period as this adjusts the size of the bank’s loan book for the mix of risk within it. For example, mortgages are generally lower risk than corporate loans. Hence they have a lower risk weighting and generally lower provisions raised.
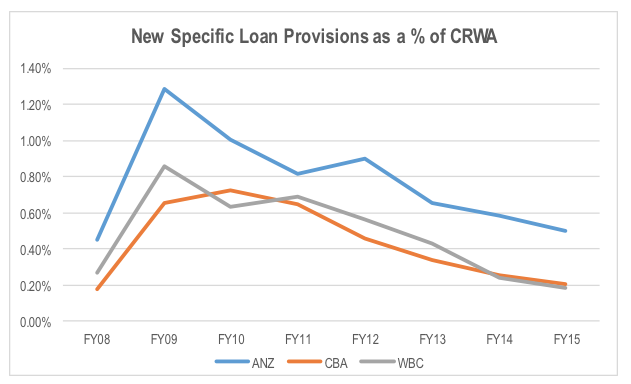
ANZ’s has raised larger specific provisions than CBA’s and WBC’s each year for some time. The offset to that has been higher write backs of prior period impairments.
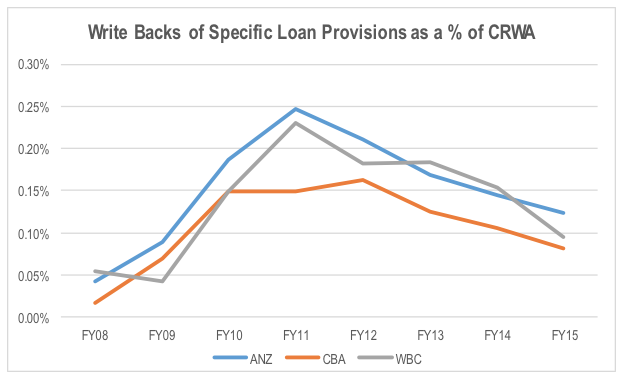
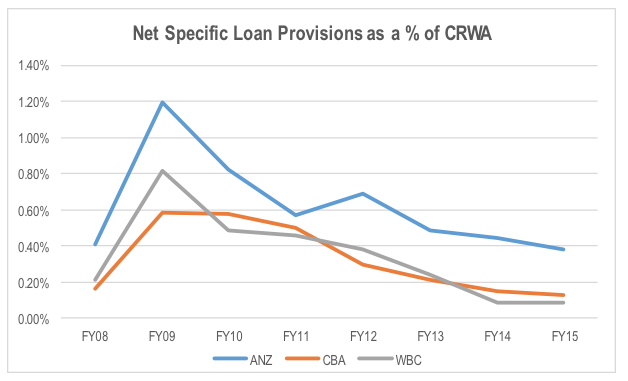
With write backs of provisions from the GFC slowing, net specific provisions are set to rise in the coming years.
The second factor has been the running down of collective provision balances after they were built up significantly during the GFC. This is effectively a write back of provisions expensed in prior year, or a negative provision that boosts earnings.
The chart below, shows the net change in collective provisions as a percentage of credit risk weighted assets each year.
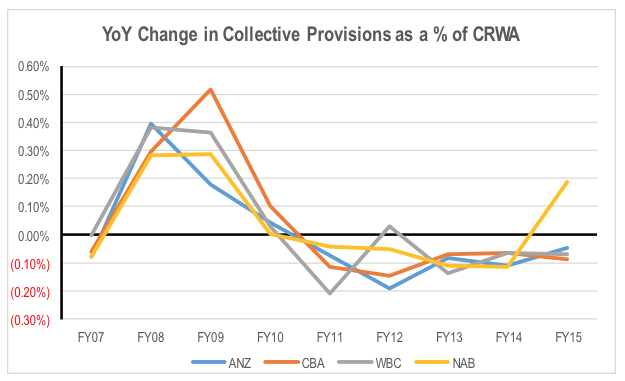
After a significant increase in Collective provisions during the GFC, the major banks have wound back the provision balance as a percentage of CRWA each year from FY10. This boosts earnings in a given year relative to sustainable levels, as a reduction in provisions yields a one off benefit that cannot be sustained into perpetuity.
Having said that, the absolute level of the collective provision balances for the majors is not significantly below their long term averages. The chart below says the long term average collective provision for the majors over the last 28 years 90-100bpts. ANZ, CBA and WBC were at around 85-90bpts at the end of FY15. CBA fell further to 82bpts at the end of 1H16.
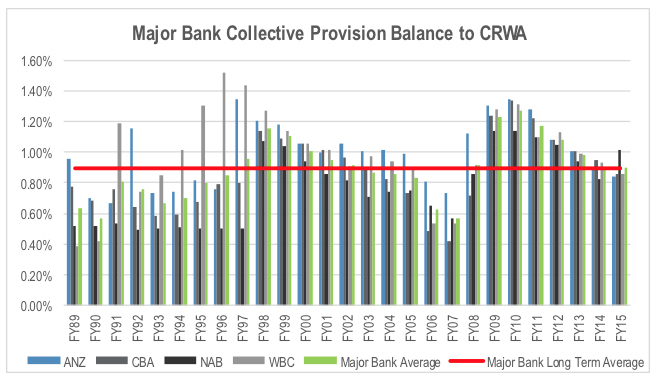
The chart also shows the cyclical nature of the Collective Provision balance, with the increases occurring rapidly during tougher economic times, and the reductions occurring over a longer period.
If we look at the impact on FY14, FY15 and FY16 earnings from adjusting bad and doubtful debt provisions to 50bpts of CRWA (more in line with the longer term average), it would have the following impact on EPS.
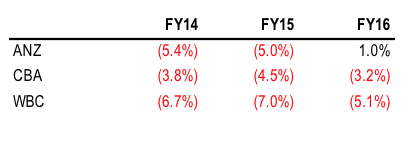
This effectively correlates to the EPS growth headwind factored into the forecast from a normalisation of bad debt provisions over the next few years.
Falling bad debt provisions have overstated the underlying sustainable rate of earnings growth for the banks in recent years. With asset quality becoming a bigger issue, this is likely to turn from a tailwind to a headwind for earnings growth in coming years.
Of course if there is a significant reduction in asset prices, provisions can rise quickly and significantly, putting pressure on the balance sheet and a bank’s capital adequacy.
In valuing banks, it is important to look at the sustainable earnings base and return generation of the business. Consequently, extrapolating lower than normal level of provisioning in a valuation is likely to result in an overestimation of the bank’s worth.
Stuart Jackson is a Senior Analyst with Montgomery Investment Management. To invest with Montgomery domestically and globally, find out more.
This post was contributed by a representative of Montgomery Investment Management Pty Limited (AFSL No. 354564). The principal purpose of this post is to provide factual information and not provide financial product advice. Additionally, the information provided is not intended to provide any recommendation or opinion about any financial product. Any commentary and statements of opinion however may contain general advice only that is prepared without taking into account your personal objectives, financial circumstances or needs. Because of this, before acting on any of the information provided, you should always consider its appropriateness in light of your personal objectives, financial circumstances and needs and should consider seeking independent advice from a financial advisor if necessary before making any decisions. This post specifically excludes personal advice.
INVEST WITH MONTGOMERY
Mike
:
Does Montgomery still own shares in the big banks, particularly given the trend in bad debts?
Your February report showed CBA as one of your Top Ten completed holdings, and December’s showed ANZ, Westpac and CBA.
Thanks
Stuart Jackson
:
Hi Mike, we currently hold WBC and CBA. We view these companies as having positive risk/return even when the adjustments to provisions set out in the post are made, as well as other risk related adjustments are undertaken as well.
TMorton
:
I am puzzled by the final chart titled “major bank collective provision balance to crwa”. Where are the figures from?
I would think that the #s for the early 90s would be much higher. WBC, for example, reported period loss provisions of 1.57%, 4.13%, and 1.88% of total loans for FY91, FY92, and FY93, respectively. If one wants to look at balance sheet reserve / total loans for same periods, the numbers are 2.94%, 5.31%, and 3.99%. I realize am comparing apples and oranges by looking at total provisions as opposed to just the collective provision, but surely the collective provision is a meaningful portion of the total provision. I am also looking at total assets instead of credit risk weighted assets, which is an offset in the other direction. In any case, it seems implausible to me that the early 90s recession and near death experiences for WBC and ANZ would correlate with such benign collective provision trends.
Thank you in advance for your response.
Stuart Jackson
:
Thanks for the question. The difference is in the denominator. The mix of the major bank loan books has changed dramatically since the late 1980s and early 1990s. This has seen a significant change in the ratio of gross loans to credit risk weighted assets. In the early 1990s, CRWA was actually higher than gross loans given the banks’ exposure to non-investment grade corporates (which had a credit risk weighting of 150%). The other distortion is changes to risk weightings over time as a result of the various Basel updates. This will bias the average down relative to a more like-for-like measure to some extent and make comparisons a little more difficult. The increase in APRA’s mortgage risk weights from 1 July this year will offset this distortion a little (and we assume mortgage risk weights for the major banks increase by a further 5bpts in the long term), but there are still some distortions that need to be adjusted for when looking at historical figures. Sadly, nothing is perfect, but at least CRWA does make some adjustments for the changes in the mix of the risk profile in the loan book over time.
Craig Phillips
:
giday Jacko
nice article !!
Stuart Jackson
:
Thanks Craig