
Who cares wins?
While the U.S. presidential campaign is entertaining to watch from afar (and more than a little disturbing this time around), spare a thought for our friends in the U.S. who have to sort through the rhetoric, lies, and assassination attempts to select their leader for the next four years.
While doing that, remember that the U.S. S&P500 stock market index is the barometer from which all global markets seem to take their temperature. It is, therefore, worth making some general observations about U.S. stock market performance during election years.
Many investors will be wondering what a re-elected Democratic party or a Trump presidency might mean for their investments. And if you aren’t thinking about it, there will be no shortage of column inches dedicated to imploring you to do so.
History, however, provides some insights, and remembering these will equip you to navigate the outcome successfully.
Even though volatility can be amplified during an election year, Figure 1 reveals that historically, the U.S. stock market has tended to end an election year with gains more often than non-election years.
According to Blackrock, since 1926, 30 per cent of non-election years have lost money, but only 17 per cent of election years. That doesn’t really mean anything, of course, because each new year will work to change those statistics. Nevertheless, since 1926, the U.S. stock market ended an election year in negative territory just four times and ended positively 20 times. Perhaps the hope of a better four years than the last four inspires investors, or maybe it’s just the promise of handouts.
Figure 1. U.S. stocks historically lose money less often in election years 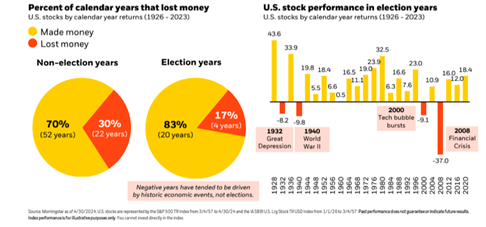 Source: Blackrock
Importantly, in the absence of the distraction of an election, investors may be more focused on idiosyncratic issues, resulting in the S&P500 experiencing losses almost twice as frequently (30 per cent of non-election years).
What may be more interesting is whether Democrats or Republicans produce better outcomes for stock market investors during their reigns.
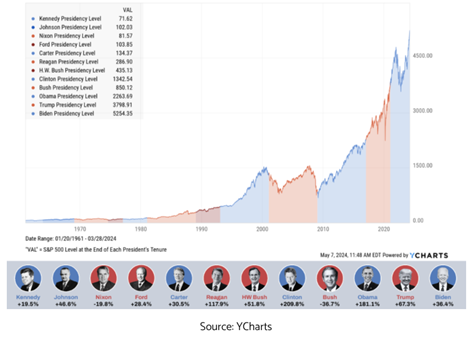
As Figure 2 reveals, since 1960, there have been 12 U.S. Presidents, equally divided between Democrats and Republicans. As Figure 2, reveals, each term produced a positive stock market performance except for Richard Nixon’s Term as 37th president and George Bush Junior’s term between 2001 and 2009. Under Nixon, the S&P500 fell almost 20 per cent, and under Bush, the market fell 36.7 per cent. Both presidents, it should be noted were Republican.
Of course, Richard Nixon’s second term was cut short by the Watergate scandal, and in 1974, the world witnessed a then unprecedented trifecta of economic woes, including declining economic growth, aggravated inflation and an international payments imbalance made worse by surging oil prices. Meanwhile, Bush’s term ended with the global financial crisis (GFC) – a crisis that was arguably triggered by financial and corporate malfeasance in the U.S. under Bush’s watch.
Figure 2. S&P500 performance during presidencies.
 Perhaps a little more curious is the average performance of the S&P500 when examined in light of the party that controls U.S. Congress and, therefore, legislation.
As Figure 3 shows, since 1950, irrespective of which party the president belongs to, a Congress controlled by the Republicans has produced a better ‘average’ outcome. (Keep in mind, averages are of limited value, to wit; if my head was in an oven and my feet in a freezer, my ‘average’ temperature would be okay, but I would be dead!) Before getting too excited, a divided Congress produced the best outcome of all. Of course, the poorer showing for all the average returns under a Republican president would be in part thanks to the Nixon and Bush presidencies.
Figure 3. Average annualised performance S&P500, 1950 – 2023
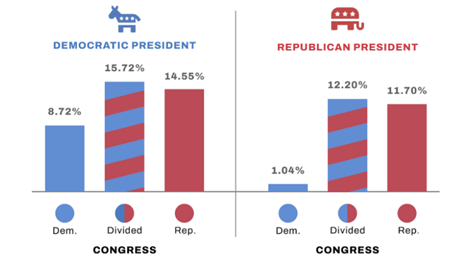 Source: YCharts
So, what we know is that in the last 64 years, the market has ended a presidential term in the red twice, and on both occasions, it was after a Republican presidency. We also know election years are more likely to end positively than negatively. Finally, we know that a divided U.S. Congress produces better average returns for equity investors, with the highest average return produced by a divided Congress and a Democratic president. On balance, and if history is any guide, it would seem stock market investors will be best served by Kamala Harris as president and the U.S. equivalent of a hung parliament.
But before giving any of these conclusions too much credibility, it’s worth noting that going back over the last 35 presidential terms – all the way back to Theodore Roosevelt’s first term beginning in 1901, there were only six presidential terms that coincided with a negative return for the S&P500. Admittedly, however, five of those six were during Republican presidencies, including two for George Bush, Richard Nixon, Herbert Hoover and William Howard Taft. The single negative S&P500 period coinciding with a Democratic president was Woodrow Wilson’s presidency from 1913 to 1921.
The U.S. market is currently worth about US$50 trillion, and the U.S. economy produces gross domestic product (GDP) worth a little more than half that again. A single individual can only have so much influence – and perhaps much less if Congress is divided. It’s also true that you are likely investing in equities for longer than four years, after which there will be yet another election. It is, therefore, worth focusing on your investment strategy than on what the U.S. election cycle produces.
Roger Montgomery is the Founder and Chairman of Montgomery Investment Management. Roger has over three decades of experience in funds management and related activities, including equities analysis, equity and derivatives strategy, trading and stockbroking. Prior to establishing Montgomery, Roger held positions at Ord Minnett Jardine Fleming, BT (Australia) Limited and Merrill Lynch.
He is also author of best-selling investment guide-book for the stock market, Value.able – how to value the best stocks and buy them for less than they are worth.
Roger appears regularly on television and radio, and in the press, including ABC radio and TV, The Australian and Ausbiz. View upcoming media appearances.
This post was contributed by a representative of Montgomery Investment Management Pty Limited (AFSL No. 354564). The principal purpose of this post is to provide factual information and not provide financial product advice. Additionally, the information provided is not intended to provide any recommendation or opinion about any financial product. Any commentary and statements of opinion however may contain general advice only that is prepared without taking into account your personal objectives, financial circumstances or needs. Because of this, before acting on any of the information provided, you should always consider its appropriateness in light of your personal objectives, financial circumstances and needs and should consider seeking independent advice from a financial advisor if necessary before making any decisions. This post specifically excludes personal advice.