
What’s the CAGR?
I am fascinated by the standard descriptions of returns cited by commentators in the real estate market. I am also disappointed that a regular opportunity to educate investors about returns is so frequently missed.
Back in July, an article in The Australian Financial Review, entitled Renovators’ return: How to maximise property value in 2025, observed, “The nurse and engineer have transformed the house they bought in Adelaide’s seaside Glenelg for $450,000 back in 2012. They’re now looking to sell for $1.9 million, a four-fold return compared with the doubling of house prices over the same period.”
The four-fold gain sounds impressive, doesn’t it? It is undoubtedly much better than the general market. But is a fourfold return over 13 years as remarkable as it initially sounds?
To work that out, we need to establish something called the Compounded Annual Growth Rate (CAGR). The CAGR is the annual compounded return. It’s the yearly return assuming any returns are reinvested every year in the same asset.
As an aside, it’s also worth noting the CAGR is the smoothed annual average return, the number that produces the end value over the number of years since the asset was purchased.
Let me explain with a. simple example. Suppose you invested $250,000 in a security, a property or an artwork. After 20 years, the asset is sold again for $4 million. Table 1., shows a hypothetical return profile over 20 years on the left side of the Table and the effective equivalent CAGR on the right.
Table 1. Smoothed effect of CAGR
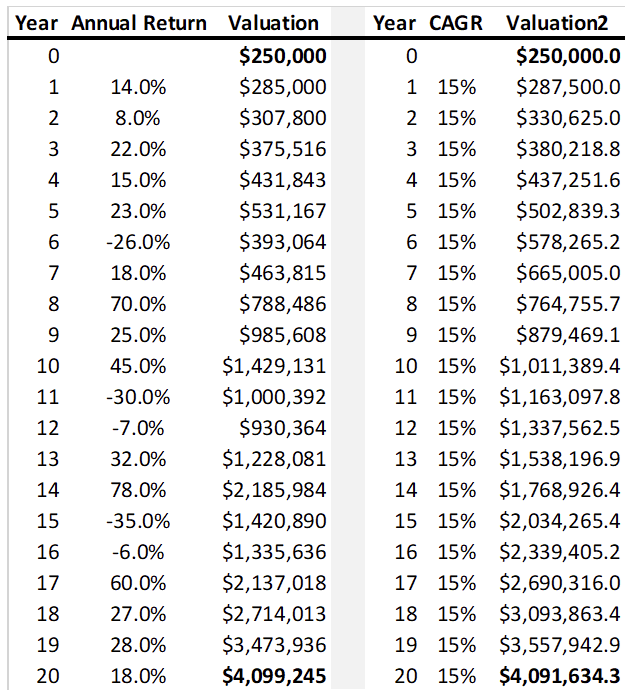
As Table.1, reveals there have been some heady years and some disastrous years. The best year was a 78 per cent return in the 14th year. The worst year was a negative 35 per cent in the 15th year, wiping $765,000 off the asset’s value in a single year.
The average of those annual experiences is a compounded annual return of 15 per cent. If the initial purchase price is compounded at 15 per cent each year, the resultant value, in this case, after 20 years, is the same as the actual experience. The $250,000 grows to $4 million.
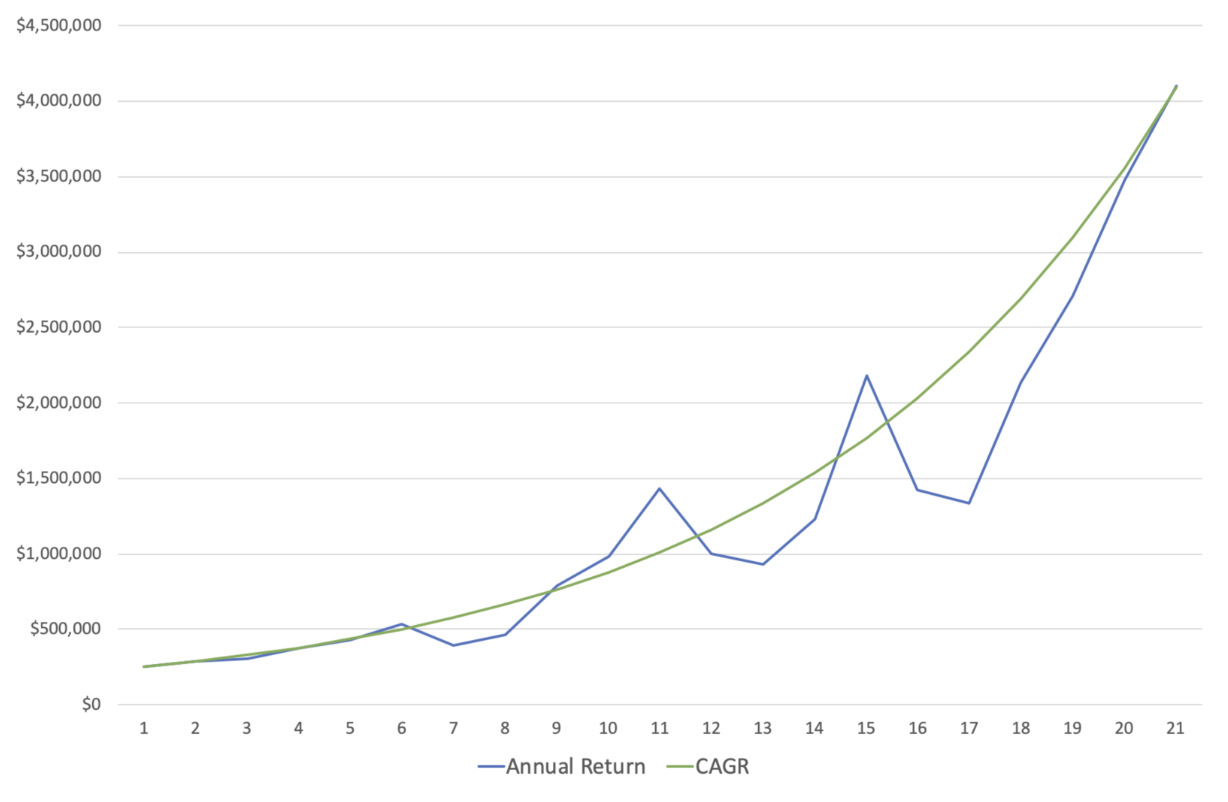
There’s something to be taken away from this. Suppose you were to visit an adviser and they reveal their compounded annual growth rate. In that case, it is worth remembering that the average doesn’t reveal the entire story because it smooths the returns, masking the volatility. If you do see an adviser, be sure to ask them for the actual annual history of returns (Figure 1.) so you can understand what the best and worst years might look like in the future.
Figure 1. Annual and CAGR plotted.
Now that we understand the usefulness and shortcomings of CAGR, let’s return to the couple in the AFR article.
Let’s assume the couple discussed in the article purchased their Glenelg house precisely 13 years ago in July of 2012 and sold it for $1.9 million in July 2025. To determine the CAGR, we can enter a formula in Excel that is a variant of the Present Value formula, which solves for the return. It looks like this:
R = [(FV/BV)^(1/n)]-1
Where R equals the CAGR, FV is the Final Value, BV is the Beginning Value, and n is the number of years.
Inserting the information provided by the AFR article, we arrive at:
R = [($1,900,000 / $450,000)^(1 / 13)]-1
R = [(4.222)^(.077)]-1
R = [1.117]-1
R = 0.117
R = 11.7%
I would say, yes, the couple in the article appear to have generated an excellent return, especially when one considers the return is Capital Gains Tax (CGT) free because it was their primary place of residence.
Of course, I say, appears to have generated an excellent return because the article goes on to say the subject couple renovated the property. Those additional costs need to be included in the cost base of the property (admittedly at a later date), which must reduce the CAGR.
A more recent AFR article reported on the new suburb record price paid for a house on Sydney’s lower north shore suburb of Mosman.
The August 6 article states, “The starter gun on the Sydney trophy home spring selling season has fired early, with a $43 million-plus sale of a Mosman harbourside home clocking the highest price ever paid for a residential Sydney property north of the Harbour Bridge.
Property records show the vendor … paid $5.5 million for the McLean Crescent home in 2010. Now, 15 years on, the two-storey abode has sold for about eight times more to an unidentified buyer.”
With the above formulae, we can determine the CAGR;
R = [($43,000,000 / $5,500,000)^(1 / 15)]-1
R = [(7.82)^(.067)]-1
R = [1.148]-1
R = 0.148
R = 14.8%
Again, another very good return, especially CGT free.
Money compounding at 15 per annum will result in the value doubling roughly every five years. If money doubles every five years, the value of an asset will be twice the original value in five years’ time, four times the original value in 10 years, eight times the original value in 15 years, and 16 times the original value in 20 years. You should be aiming for 15 per cent, if you can get it!
Knowing that, and keeping in mind 15 per cent is an excellent return to aim for, you now have a quick measure of whether a reported total return is higher or lower than 15 per cent. If the value hasn’t doubled in five years or quadrupled over 10 years, the investor’s annual compounded return must be less than 15 per cent. Alternatively if someone tells you they doubled their money over 10 years, you now know they generated a CAGR of much less than 15 per cent.
Adding CAGR and the 15 per cent signpost to your mental financial framework can be very handy when making investment decisions, for example when comparing historical track records. CAGR doesn’t contain all the information we need to comfortable, but it certainly puts you a step ahead of most other people who might not have heard of it.
Roger Montgomery is the Founder and Chairman of Montgomery Investment Management. Roger has over three decades of experience in funds management and related activities, including equities analysis, equity and derivatives strategy, trading and stockbroking. Prior to establishing Montgomery, Roger held positions at Ord Minnett Jardine Fleming, BT (Australia) Limited and Merrill Lynch.
He is also author of best-selling investment guide-book for the stock market, Value.able – how to value the best stocks and buy them for less than they are worth.
Roger appears regularly on television and radio, and in the press, including ABC radio and TV, The Australian and Ausbiz. View upcoming media appearances.
This post was contributed by a representative of Montgomery Investment Management Pty Limited (AFSL No. 354564). The principal purpose of this post is to provide factual information and not provide financial product advice. Additionally, the information provided is not intended to provide any recommendation or opinion about any financial product. Any commentary and statements of opinion however may contain general advice only that is prepared without taking into account your personal objectives, financial circumstances or needs. Because of this, before acting on any of the information provided, you should always consider its appropriateness in light of your personal objectives, financial circumstances and needs and should consider seeking independent advice from a financial advisor if necessary before making any decisions. This post specifically excludes personal advice.